A Good Graphing Tool
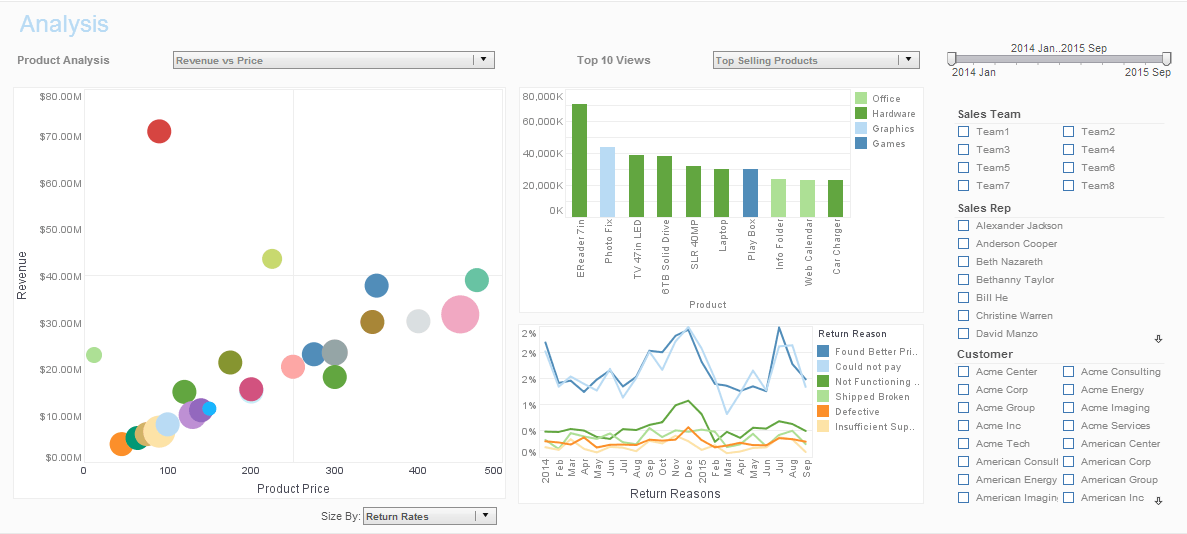
Are you looking for good tools for graphing a chart? InetSoft provides both free and commercial chart graphing tools. View a demo and try them out for free. Visualize Free is a free chart and graph application. No software to install, just upload your spreadsheet.

LineElement.setStartArrow(boolean)
Specifies whether an arrow should be drawn at the start of the line (first point).
ParametersBoolean true: draw arrow false: do not draw arrowExample (Report or Viewsheet)
 importPackage(inetsoft.graph)
 importPackage(inetsoft.graph.data)
 importPackage(inetsoft.graph.scale)
 importPackage(inetsoft.graph.aesthetic)
 importPackage(inetsoft.graph.element)

 var arr = [["State","Quantity"], ["NJ",100], ["NY",300],
            ["PA",200]];
 dataset = new DefaultDataSet(arr);
 graph = new EGraph();
 elem = new LineElement("State", "Quantity")
 elem.setStartArrow(true);
 graph.addElement(elem);
SchemaElement
The SchemaElement object contains user-defined visual elements that can be added to the graph. To create a new SchemaElement object, call the SchemaElement constructor.
var elem = new SchemaElement("State", "Quantity");
You can pass a set of field names (e.g., 'State', 'Quantity') to the constructor, or specify these later using the addDim() and addVar() methods.
Example (Report or Viewsheet) importPackage(inetsoft.graph)
importPackage(inetsoft.graph.data)
importPackage(inetsoft.graph.scale)
importPackage(inetsoft.graph.aesthetic)
importPackage(inetsoft.graph.element)
importPackage(inetsoft.graph.schema)
var arr = [["State","Hi","Upper","Median","Lower","Lo"],
["NJ", 200, 180, 150, 120, 100],
["NJ", 220, 170, 140, 110, 105],
["NY", 300, 250, 230, 150, 80]];
dataset = new DefaultDataSet(arr);
graph = new EGraph();
var elem = new SchemaElement();
elem.addDim("State")
elem.addSchema("Hi","Upper","Median","Lower","Lo")
elem.setPainter(new BoxPainter());
graph.addElement(elem);
SchemaElement.setPainter(painter)
Specifies the SchemaPainter object to be used in drawing the visual chart elements such as whiskers plots, candle plots, and tock charts.
Parameterpainter BoxPainter: Box and whiskers plot CandlePainter: Candle plot StockPainter: Stock chartExample (Report or Viewsheet)
 importPackage(inetsoft.graph)
 importPackage(inetsoft.graph.data)
 importPackage(inetsoft.graph.scale)
 importPackage(inetsoft.graph.aesthetic)
 importPackage(inetsoft.graph.element)
 importPackage(inetsoft.graph.schema)

 var arr = [["State", "Hi", "Lo", "Open", "Close"],
            ["NJ", 200, 100, 120, 150],
            ["NY", 300, 100, 200, 120]]
 dataset = new DefaultDataSet(arr);
 graph = new EGraph();
 var elem = new SchemaElement();
 elem.addDim("State")
 elem.addSchema("Hi", "Close", "Lo")
 elem.setPainter(new StockPainter());
 graph.addElement(elem);
SchemaElement.addSchema(col)
Specifies the SchemaPainter object to be used in drawing the visual chart elements.
Parametercol list of columns for schema bindingExample (Report or Viewsheet)
 importPackage(inetsoft.graph)
 importPackage(inetsoft.graph.data)
 importPackage(inetsoft.graph.scale)
 importPackage(inetsoft.graph.aesthetic)
 importPackage(inetsoft.graph.element)
 importPackage(inetsoft.graph.schema)

 var arr = [["State", "Hi", "Lo", "Open", "Close"],
            ["NJ", 200, 100, 120, 150],
            ["NY", 300, 100, 200, 120]]
 dataset = new DefaultDataSet(arr);
 graph = new EGraph();
 var elem = new SchemaElement();
 elem.addDim("State")
 elem.addSchema("Hi", "Close", "Lo")
 elem.setPainter(new StockPainter());
 graph.addElement(elem);
More Articles About Graphing Tools
Central Banking Dashboards - Central banking dashboards track a variety of Key Performance Indicators (KPIs) and metrics to monitor economic stability, financial health, and operational efficiency. Here are some of the key KPIs and metrics, along with their definitions and significance in performance management: 1. Inflation Rate Definition: The rate at which the general level of prices for goods and services rises, leading to a decrease in purchasing power. Significance: Central banks aim to keep inflation within a target range to ensure economic stability. Monitoring inflation helps in making decisions about interest rates and other monetary policies...
Enterprise MDM - While MDM is an enterprise initiative, I think in the end it should be a horizontal kind of platform solution for the organization. I think it's best, and most of the success will come by looking at the problem a little bit more vertically and trying to solve actual business problems. When should vendor technology evaluations and selections come into the process? Are there any tips for evaluating and sorting out MDM technology options? Well, there are multiple definitions of MDM out there. I think that's one issue that I know everybody is dealing with because we often still get questions what is MDM? What exactly do you mean by that? So I think that there are a lot of rival definitions...
Good Computer Dashboard Software - The name of the game is Computer Dashboard Software. Designs that are easy to use and easy to deploy, conscious of the latest technologies to improve and to have cutting edge innovation. We are a business intelligence software company offering visually-compelling, interactive computer dashboard that ensures greater end-user adoption plus pixel-perfect report generation, scheduling, and bursting. We believe software should be seamless. Quick, easy, accessible. Experience our free Demo and Test Drive our dashboard with ease! We help compile and assist in the creation to optimize the use of your data...
HHS Dashboard - In addition to using business intelligence systems to track internal operation of the agency related to employee job function, training, etc., HHS also has unique responsibilities to convey health and wellness data to the public, and to try to encourage healthy behavior and lifestyle. Business Intelligence analysis and data presentation can be hugely influential in achieving this goal, as illustrated, for example, by the department's efforts to effectively communicate the state of Covid transmission and management on a national and local level. (See https://public-data-hub-dhhs.hub.arcgis.com/.)...
How Do you Analyze Export Data? - Trade statistics is all about understanding the pattern of trade, trade policies of a particular country, and specific trade blocks in general. It is keeping track of various policies and programs introduced by the Trade blocks all over the world. It requires specific tools to analyze the strategic position of export conditions of the world. Individual companies can use these to diversify trade and adjust the sail towards them...
KPMs for Pediatric Healthcare - Key performance metrics in pediatric healthcare are essential for assessing the quality of care provided to children and ensuring optimal health outcomes. One crucial metric is immunization rates, which measure the percentage of children receiving recommended vaccines within the recommended timeframe. High immunization rates are vital for preventing the spread of infectious diseases and protecting the health of the pediatric population. Monitoring immunization rates allows healthcare providers to identify areas of improvement and implement strategies to increase vaccination coverage, ultimately reducing the risk of vaccine-preventable illnesses in children...
