Grouping and Summarization of Tabular Data

This section discussed grouping and summarization of tabular data. Many business reports require some processing on the raw data before presenting them as tables. The most common processing is the grouping and summarization of table rows. This is usually a post data retrieval operation and takes place after the data is loaded into a lens object and bound to an element.

Sorting and Grouping

Sorting and grouping of tables is by far the most common operation in business reports. Grouping is dependent on the sorting of grouping columns. After row grouping is produced, further processes can be performed, such as finding the top N groups from the grouped results.

Sorting

Sorting of tables is ideally done by a database. When a data set is large, however, sorting in memory may be impossible. There are two classes in Style Intelligence that produce a sorted table.

Grouping

Grouping in Style Intelligence consists of two functions: grouping of rows based on one or more columns and summarization on the grouped sections. If grouping is based on one column, all rows with the same value on that column are grouped into one section. A summarization row is added to each section. The summarization is specified with any valid formula. The end result would be in the following form (assuming subtotal and grand total summarization):

A 1
2
3
B 1
4
5

Total 8

If grouping is based on multiple columns, the grouping is nested. What this means is that a table is first grouped on the first grouping column and within each section, rows are grouped on the second grouping column, and so on. The end result would be in the following form (assuming subtotal and grand total summarization):
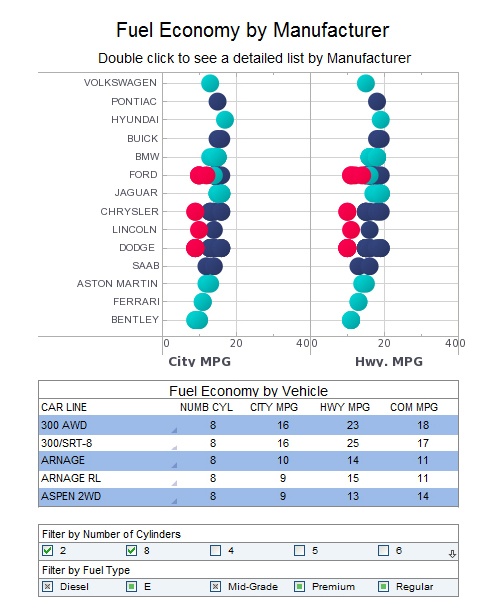
visual report

There are a few options that control how the grouping is done. By default, the grouping columns are shown in full. The first example would actually be rendered as the following by default:

A 1
A 2
3
B 1
B 4
5
Total 8

It is possible to control whether an extra row, containing the group headers (the values of the grouping column), is added before each section. By default this is turned off. If we turn it on, the result would look like the following:

A
A 1
A 2
3
B
B 1
B 4
5
Total 8

Grand Total Label property controls the label of the table summarization row. If it is set, the label is added to the table summarization row (grand total) as the first cell value.

A
1
2
3
B
1
4
5
Total 8

If we do not want to add an additional row for the group headers, we can set the option 'Group Header In Place', so the above table would look like the following:

A 1
2
3
B 1
4
5
Total 8

Although it is possible to implement Grouping and Summarization programmatically, the recommended way is to use the Report Designer GUI. See the Report Creation With Grouping/Summarization chapter for a complete example.

More Articles About Reporting

Automotive Industry Dashboard Example - The rapid advancement of data dashboard technology has affected all major sectors around the world including the automotive industry. The effects of electric cars, personalization, automated cars, driver assists, telematics and augmented reality are discussed every day in executive offices and over drinks in the evening. All car manufacturers understand that there is a need for transformation in the market. However, the challenge is: how do they start transforming themselves when their processes and employees are distributed in dozens of countries? How do they become agile and innovative? Before automotive manufacturers begin the transformation process, they must create a roadmap or strategy. To do this successfully, they need to implement a dashboard system...

Different Sets of Business Intelligence and Analysis Needs - BI software today needs to be highly flexible and be able to recognize the needs of different classes of users. Different classes of users have different sets of business intelligence and analysis needs. A business user views their world very differently from a trade-operations user; an IT user views the world radically different from a business user. InetSoft understands this and delivers tailored visualizations based on the different user needs and perspectives. Utilizing the data collected from the underlying source infrastructure InetSoft can model, pivot, correlate and aggregate the data events according to particular end user requirements...

Looking for the Best Tool to Create Dashboards - Are you searching for the best tool to create dashboards? InetSoft's pioneering dashboard reporting application produces great-looking web-based dashboards with an easy-to-use drag-and-drop designer. Maximize self-service for all types of people. Top rated by customers on G2.com. View a demo and try interactive examples...

Option for Scorecard Applications - InetSoft's drag and drop software allows developers and even end-users to quickly create sophisticated scorecards and dashboards. With intuitive point-and-click capabilities, managers can drill into scorecard metrics to identify root causes of performance problems for faster responses. Further, InetSoft's dashboard software allows you to create balanced scorecards that are color-coded for variances above or below targets and have no limit to the kind of key performance indicators you can create and track on the scorecard...

Solution for Smart Data Analysis - To cut through information overload of running a business, part of your BI strategy must be smart data analysis. Smart data is often described as data with hidden qualities, such as veracity and value. Finding data with these qualities will help a decision maker hone in on and exploit metrics to their fullest potential. The main difference between smart data and normal boring data is that smart data is the best path toward action. KPI's, scorecards, thresholds can all be considered smart data. But smart data is also cause driven. Smart data often attempts to answer the question "What condition lead to this result?...

Why is Data Grid Cache Better? - A pure in-memory BI solution means that you are limited to analyzing or reporting on the size of the database by the size of memory in the BI server. Yes, memory costs continually come down, but terabyte memory machines still cost multiples of gigabyte memory machines. The data grid cache solution suffers from no such limits and can scale up as performance, usage concurrency, and database size grow by simply adding memory and/or commodity-priced servers in a cluster. Therefore, a pure in-memory approach is not the best option for scalable, multi-user BI apps. 64-bit computing on column-based technologies can provide a better alternative for hefty OLAP projects...

Previous: Customizing a Report with Presenters