Java Graph
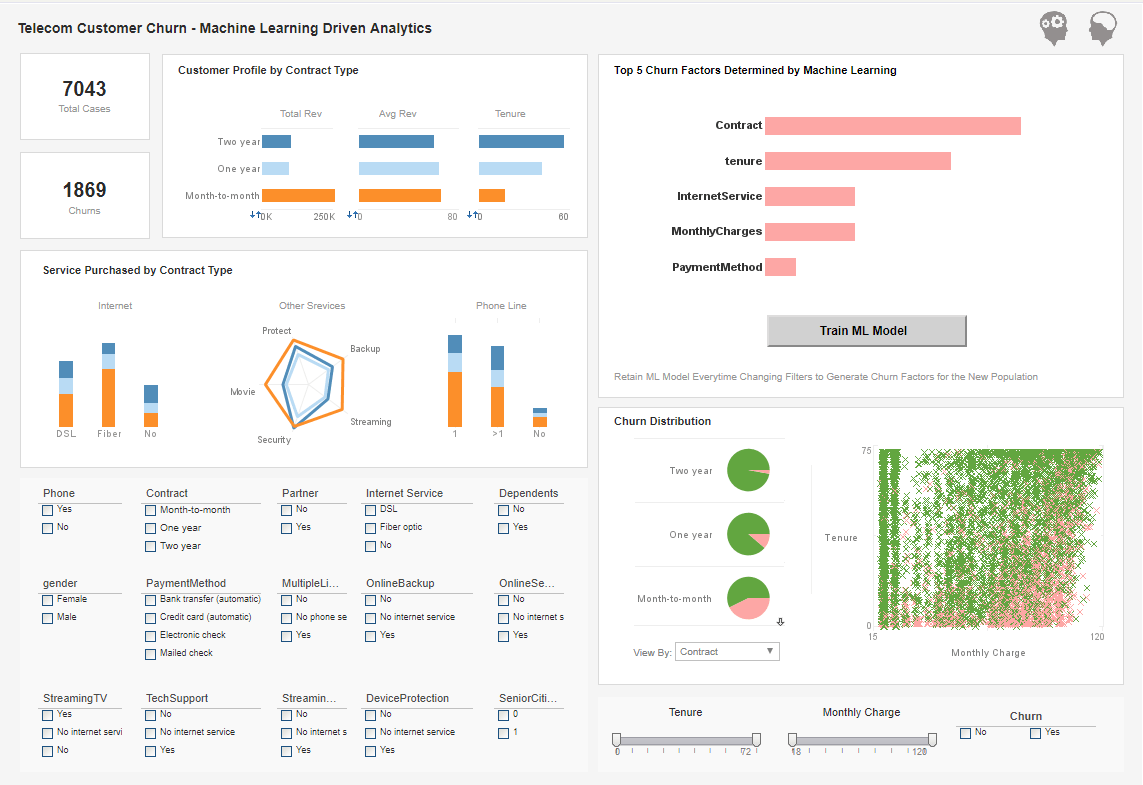
Below are some examples of graph charts generated by InetSoft's Java graph charting engine. And following is documentation on using InetSoft's JavaScript-like API for programmatically generating charts. Alternatively use InetSoft's drag-and-drop chart designer.

Documentation
LegendSpec.setBackground(value)
Specifies the legend background color.
Parametervalue a java.awt.Color objectExample (Report or Viewsheet)
 importPackage(inetsoft.graph)
 importPackage(inetsoft.graph.data)
 importPackage(inetsoft.graph.element)
 importPackage(inetsoft.graph.aesthetic)
 importPackage(inetsoft.graph.scale)
 importPackage(inetsoft.graph.coord)
 importPackage(inetsoft.graph.guide.form)

 var arr = [["State", "Quantity"], ["NJ",200], ["NY",300]];
 dataset = new DefaultDataSet(arr);
 graph = new EGraph();
 var elem = new IntervalElement("State", "Quantity");
 var frame = new CategoricalColorFrame();
 frame.setField("State");
 var spec = new LegendSpec();
 spec.setBackground(java.awt.Color(0xff00ff));
 frame.setLegendSpec(spec);
 elem.setColorFrame(frame);
 graph.addElement(elem);
LegendSpec.setBorder(value)
Specifies the legend border style.
Parametervalue a GLine objectExample (Report or Viewsheet)
 importPackage(inetsoft.graph)
 importPackage(inetsoft.graph.data)
 importPackage(inetsoft.graph.element)
 importPackage(inetsoft.graph.aesthetic)
 importPackage(inetsoft.graph.scale)
 importPackage(inetsoft.graph.coord)
 importPackage(inetsoft.graph.guide.form)

 var arr = [["State", "Quantity"], ["NJ",200], ["NY",300]];
 dataset = new DefaultDataSet(arr);
 graph = new EGraph();
 var elem = new IntervalElement("State", "Quantity");
 var frame = new CategoricalColorFrame();
 frame.setField("State");
 var spec = new LegendSpec();
 spec.setBorder(GraphConstants.DASH_LINE);
 frame.setLegendSpec(spec);
 elem.setColorFrame(frame);
 graph.addElement(elem);
LegendSpec.setBorderColor(value)
Specifies the legend border color.
Parametersvalue a java.awt.Color objectExample (Report or Viewsheet)
 importPackage(inetsoft.graph)
 importPackage(inetsoft.graph.data)
 importPackage(inetsoft.graph.element)
 importPackage(inetsoft.graph.aesthetic)
 importPackage(inetsoft.graph.scale)
 importPackage(inetsoft.graph.coord)
 importPackage(inetsoft.graph.guide.form)

 var arr = [["State", "Quantity"], ["NJ",200], ["NY",300]];
 dataset = new DefaultDataSet(arr);
 graph = new EGraph();
 var elem = new IntervalElement("State", "Quantity");
 var frame = new CategoricalColorFrame();
 frame.setField("State");
 var spec = new LegendSpec();
 spec.setBorderColor(java.awt.Color(0xff00ff));
 frame.setLegendSpec(spec);
 elem.setColorFrame(frame);
 graph.addElement(elem);
More Articles About Graphing Tools
Build a BI Trial - And then you know there's additional information that you can continue to layer and build a trial based on a role or based on an objective. But these are exactly the type of information that we provide for them. We turn them from being what I would call reactive player problems to managing their performance to being proactive. They can see problems when they occur or they can anticipate performance problems before they happen...
How Is a Federated Data Management Model Different from Data Warehousing? - A federated data management model and data warehousing are two different approaches to managing and integrating data from multiple sources. Here are the main differences: Federated Data Management: Connects to multiple data sources in real-time, leaving the data in its original location. Data is accessed and processed where it resides, without creating a centralized copy. Supports data virtualization, data federation, and data integration. Ideal for real-time analytics, data sharing, and collaboration. Data Warehousing: Involves copying data from multiple sources into a centralized repository. Data is transformed, cleansed, and optimized for querying and analysis. Supports business intelligence, reporting, and historical analytics...
Marketing Client Dashboard Example - In the field of marketing consulting, handling data properly is imperative because as it enables businesses to understand market dynamics, optimize marketing strategies, enhance customer relationships, ultimately driving sales growth. Accurate data analysis allows companies to monitor and evaluate the performance of marketing campaigns, leading to more precise customer segmentation and more efficient allocation of resources. Therefore, finding a tool that enables robust data analytics and BI dashboard tools is highly valuable for marketing. Such a solution can help businesses distill useful information from large datasets to support decision-making and improve overall marketing effectiveness...
Reporting Tools to Integrate with SharePoint - It's no wonder that so many businesses adopt Microsoft SharePoint as a collaboration tool. SharePoint sites provide an easy way for organizations to share information and coordinate on projects and tasks. However, using SharePoint alone as a business intelligence tool has definite limitations. While SharePoint enables rudimentary reporting on list data, it lacks the agility to meet many of today's more elaborate reporting needs. And while it is capable of data mashup to some degree, it can only incorporate a limited number of data sources. SharePoint's reporting also lacks in self service, often requiring IT skills and knowledge of SharePoint SQL. Let InetSoft assist you with a free evaluation...
Why Are IoT Dashboards Created? - Building IoT dashboards is done for a number of purposes, including: Automatically add location, time, weather, temperature, and other external elements specific to your consumers to incoming data from your equipment; Users and operators may (remotely) monitor and manage certain assets and processes with the aid of IoT Dashboards, and depending on safety standards, they can access and operate an environment from anywhere in the globe; By preventing product failures and avoiding downtime, monitoring hardware and software performance may save operational expenses and maintenance expenditures; Find out in detail how consumers utilize IoT devices and use that information to inform your product development; Bring your own IoT analytics solution to market as soon as possible to provide clients with premium dashboards and reporting features...


