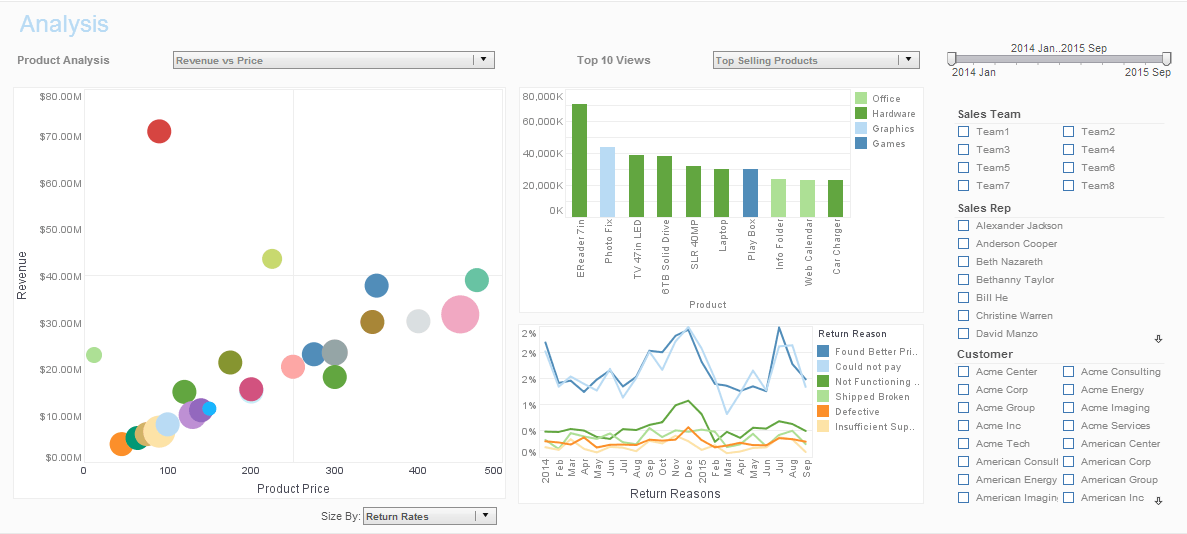
InetSoft Product Information: Tools for Creating a Web Chart
Are you looking for tools for creating a Web chart? InetSoft provides both free and commercial Web chart graphing tools. The Start Free button gives you two options for using InetSoft's dashboard visualization software.
Individual Account
Register with any email address, including free email services such as Google and Yahoo. There is no credit card required. Use the 100% web app with no desktop install. Collaborate online in real time. Use data sources such as uploaded Excel or CSV files or connect to live Google sheets. Publicly share dashboards, if you wish, via URL link. All advanced data visualization types and interactive controls are available.
Business Account
Register with any organizational (business, university, or organization) email address. There is no credit card required. Use the 100% web app with no desktop install. Collaborate online in real time. Use data sources such as uploaded Excel or CSV files or connect to live Google sheets, plus more Google apps, Facebook, databases and many other online data sources. Publicly share dashboards, if you wish, via URL link. Privately share dashboards and analyses within your organization (same email domain). All advanced data visualization types and interactive controls are available.
CategoricalColorFrame.getColor(val)
Returns the color assigned to the specified value.
Parameter
val
 a data value
Example (Report)
Bind a bar-type chart to the sample 'All Sales' query, with 'Company' (top 5) on the X-axis, and Sum(Total) on the Y-axis. Add the following script in the onLoad Handler.
importPackage(inetsoft.graph.aesthetic);
Graph1.bindingInfo.setColorField("Employee",Chart.STRING);
Graph1.bindingInfo.colorFrame = new CategoricalColorFrame;
Graph1.bindingInfo.colorFrame.setColor("Robert",
   java.awt.Color.lightGray);
var robColor =
   Graph1.bindingInfo.colorFrame.getColor("Robert")
Graph1.bindingInfo.colorFrame.setColor("Sue",robColor);
Example (Report or Viewsheet)
importPackage(inetsoft.graph)
importPackage(inetsoft.graph.element)
importPackage(inetsoft.graph.scale)
importPackage(inetsoft.graph.aesthetic)
importPackage(inetsoft.graph.data)

var arr = [["State","Quantity"],["NJ",200],["NY",300]];
dataset = new DefaultDataSet(arr);
graph = new EGraph();
var elem = new IntervalElement("State", "Quantity")
frame = new CategoricalColorFrame();
frame.setField("State");
frame.setColor('NJ',java.awt.Color(0xff0000));
var NJcolor = frame.getColor('NJ');
frame.setColor('NY',NJcolor);
elem.setColorFrame(frame);
graph.addElement(elem);
CategoricalColorFrame.setColor(val,color)
Assigns a color to the specified value.
Parameter
val data value

color java.awt.Color to represent data value
Example (Report)
Bind a bar-type chart to the sample 'All Sales' query, with 'Company' (top 5) on the X-axis, and Sum(Total) on the Y-axis. Add the following script in the onLoad Handler.
importPackage(inetsoft.graph.aesthetic);
Graph1.bindingInfo.setColorField("Employee",Chart.STRING);
Graph1.bindingInfo.colorFrame = new CategoricalColorFrame;
Graph1.bindingInfo.colorFrame.setColor("Robert",
   java.awt.Color.lightGray);
Graph1.bindingInfo.colorFrame.setColor("Sue",
   java.awt.Color(0x222222));
Example (Viewsheet or Report)
importPackage(inetsoft.graph)
importPackage(inetsoft.graph.element)
importPackage(inetsoft.graph.scale)
importPackage(inetsoft.graph.aesthetic)
importPackage(inetsoft.graph.data)

var arr = [["State","Quantity"], ["NJ",200], ["NY",300]];
dataset = new DefaultDataSet(arr);
graph = new EGraph();
var elem = new IntervalElement("State", "Quantity")
frame = new CategoricalColorFrame();
frame.setField("State");
frame.setColor('NJ',java.awt.Color(0xff0000));
frame.setColor('NY',java.awt.Color(0xff00ff));
elem.setColorFrame(frame)
graph.addElement(elem);
SizeFrame
The SizeFrame object contains the size scale for visual chart objects. You can use a SizeFrame object to represent data dimensions with size (size coding), or to apply a fixed (static) size.
Example (Report)
Bind a point-type chart to the sample 'All Sales' query, with 'Company' (top 5) on the X-axis, and Sum(Total) on the Y-axis. Add the following script in the onLoad Handler.
importPackage(inetsoft.graph.aesthetic);
Graph1.bindingInfo.setSizeField("Total",Chart.NUMBER);
Graph1.bindingInfo.sizeFrame = new LinearSizeFrame;
Graph1.bindingInfo.sizeFrame.smallest = 10;
Graph1.bindingInfo.sizeFrame.largest = 50;
Graph1.bindingInfo.sizeFrame.max = 100;
Example (Report or Viewsheet)
Bind a point-type chart to the sample 'All Sales' query, with 'Company' (top 5) on the X-axis, and Sum(Total) on the Y-axis.
importPackage(inetsoft.graph)
importPackage(inetsoft.graph.element)
importPackage(inetsoft.graph.scale)
importPackage(inetsoft.graph.aesthetic)
importPackage(inetsoft.graph.data)

var frame = new StaticSizeFrame;
frame.setSize(30);
var elem = Graph1.graph.getElement(0); // point elements
elem.setSizeFrame(frame);
Customer Testimonial
“The more I get into it, the more capabilities I discover that allow me to organize data in ways that make the most sense to me, and excitingly, our users will be able to benefit from these same features. Additionally, Style Intelligence offers truly superior dashboard graphics. Thus, we’ll be able to provide our customers with the ability to create highly polished, professional reports.” - Tadd Meyers, Business Intelligence Manager at NCN


