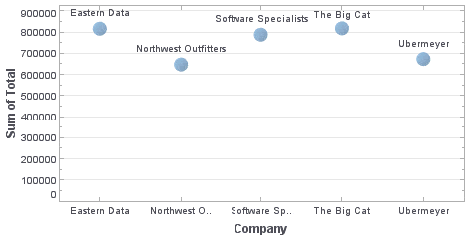
InetSoft Product Information: Web Chart Generator
Looking for a Web chart creator? Since 1996, InetSoft has been offering free and commercial Web-based charting and reporting tools.
Style Intelligence is a commercial business intelligence software package for enterprise chart generation and real-time access to almost any data source. This software is also well-suited for developers to embed into other applications, on-premise or SaaS-based.
ShapeForm.setPoint(value)
Specifies the pixel location or proportional location where the shape is placed. (Positive values specify distance from left/bottom. Negative values specify distance from right/top.)
Type
value a subclass of java.awt.geom.Point2D
e.g.,
java.awt.Point for pixels
java.awt.geom.Point2D.Double for proportion
| #1 Ranking: Read how InetSoft was rated #1 for user adoption in G2's user survey-based index | Read More |
Example (Report or Viewsheet)
importPackage(inetsoft.graph)
importPackage(inetsoft.graph.element)
importPackage(inetsoft.graph.scale)
importPackage(inetsoft.graph.aesthetic)
importPackage(inetsoft.graph.data)
importPackage(inetsoft.graph.coord)
importPackage(inetsoft.graph.guide.form)

var arr = [["State","Quantity"], ["NJ",200], ["NY",300]];
dataset = new DefaultDataSet(arr);
graph = new EGraph();
var elem = new IntervalElement("State", "Quantity");
var shape1 = new ShapeForm();
var shape2 = new ShapeForm();

// Set shape1 points in pixels:
shape1.setPoint(new java.awt.Point(150, 100));
shape1.setShape(GShape.FILLED_TRIANGLE);
shape1.setColor(java.awt.Color(0xff0000));
shape1.setSize(new java.awt.Dimension(10,10));

// Set shape2 points proportionally:
shape2.setPoint(new java.awt.geom.Point2D.Double(.5,.5));
shape2.setShape(GShape.FILLED_TRIANGLE);
shape2.setColor(java.awt.Color(0xff0000));
shape2.setSize(new java.awt.Dimension(20,20));
graph.addForm(shape1);
graph.addForm(shape2);
graph.addElement(elem);
 |
View a 2-minute demonstration of InetSoft's easy, agile, and robust BI software. |
ShapeForm.setRotation(value)
Specifies the shape rotation in degrees.
Type
Number
Example (Report or Viewsheet)
importPackage(inetsoft.graph)
importPackage(inetsoft.graph.element)
importPackage(inetsoft.graph.scale)
importPackage(inetsoft.graph.aesthetic)
importPackage(inetsoft.graph.data)
importPackage(inetsoft.graph.coord)
importPackage(inetsoft.graph.guide.form)

var arr = [["State","Quantity"], ["NJ",200], ["NY",300]];
dataset = new DefaultDataSet(arr);
graph = new EGraph();
var elem = new IntervalElement("State", "Quantity");
var shape1 = new ShapeForm();
var shape2 = new ShapeForm();
shape1.setPoint(new java.awt.geom.Point2D.Double(.6,.5));
shape1.setShape(GShape.FILLED_TRIANGLE);
shape1.setColor(java.awt.Color(0xff0000));
shape1.setSize(new java.awt.Dimension(20,20));
shape1.setRotation(45);
shape2.setPoint(new java.awt.geom.Point2D.Double(.5,.5));
shape2.setShape(GShape.FILLED_TRIANGLE);
shape2.setColor(java.awt.Color(0x000000));
shape2.setSize(new java.awt.Dimension(20,20));
graph.addForm(shape1);
graph.addForm(shape2);
graph.addElement(elem);
 |
View live interactive examples in InetSoft's dashboard and visualization gallery. |
ShapeForm.setShape(shape)
Specifies the type of shape.
Type
GShape
GShape.ImageShape
Example (Report or Viewsheet)
importPackage(inetsoft.graph)
importPackage(inetsoft.graph.element)
importPackage(inetsoft.graph.scale)
importPackage(inetsoft.graph.aesthetic)
importPackage(inetsoft.graph.data)
importPackage(inetsoft.graph.coord)
importPackage(inetsoft.graph.guide.form)

var arr = [["State", "Quantity"], ["NJ", 200], ["NY", 300]];
dataset = new DefaultDataSet(arr);
graph = new EGraph();
var elem = new IntervalElement("State", "Quantity");
var form = new ShapeForm();
form.setValues(['NJ',100]);
form.setShape(GShape.FILLED_TRIANGLE);
form.setColor(java.awt.Color(0xff0000));
form.setSize(new java.awt.Dimension(50,50));
graph.addForm(form);
graph.addElement(elem);
 |
View the gallery of examples of dashboards and visualizations. |
ShapeForm.setSize(value)
Specifies the size of the shape in pixels.
Type
value
 a java.awt.Dimension object
Example (Report or Viewsheet)
importPackage(inetsoft.graph)
importPackage(inetsoft.graph.element)
importPackage(inetsoft.graph.scale)
importPackage(inetsoft.graph.aesthetic)
importPackage(inetsoft.graph.data)
importPackage(inetsoft.graph.coord)
importPackage(inetsoft.graph.guide.form)

var arr = [["State", "Quantity"], ["NJ", 200], ["NY", 300]];
var data = new DataSet(arr);
var graph = new EGraph(data);
var elem = new IntervalElement("State", "Quantity");
var form = new ShapeForm();
form.setValues(['NJ',100]);
form.setShape(GShape.FILLED_TRIANGLE);
form.setColor(java.awt.Color(0xff0000));
form.setSize(new java.awt.Dimension(50,50));
graph.addForm(form);
graph.addElement(elem);
ShapeForm.setTuple(value)
Specifies the location of the shape in logical space. The coordinates of the location are relative to the prevailing axis scaling.
Type
value
 An [X,Y] pair

Example (Report or Viewsheet)
importPackage(inetsoft.graph)
importPackage(inetsoft.graph.element)
importPackage(inetsoft.graph.scale)
importPackage(inetsoft.graph.aesthetic)
importPackage(inetsoft.graph.data)
importPackage(inetsoft.graph.coord)
importPackage(inetsoft.graph.guide.form)

var arr = [["State", "Quantity"], ["NJ", 200], ["NY", 300]];
dataset = new DefaultDataSet(arr);
graph = new EGraph();
var elem = new IntervalElement("State", "Quantity");
var form = new ShapeForm();
form.setTuple([.5,100]);
form.setShape(GShape.FILLED_TRIANGLE);
form.setColor(java.awt.Color(0xff0000));
form.setSize(new java.awt.Dimension(50,50));
graph.addForm(form);
graph.addElement(elem);
 |
Read the latest news about InetSoft's user friendly BI software and customer successes. |
ShapeForm.setValues(value)
Specifies the location of the shape in logical space. The coordinates of the location are relative to prevailing axis scaling prior to transformation. So, for a categorical X-axis (e.g., 'NJ', 'NY', 'PA', etc.), the X-value of the location should specify a categorical value (e.g., 'NJ').
Type
value
 an [X,Y] pair
Example (Report or Viewsheet)
importPackage(inetsoft.graph)
importPackage(inetsoft.graph.element)
importPackage(inetsoft.graph.scale)
importPackage(inetsoft.graph.aesthetic)
importPackage(inetsoft.graph.data)
importPackage(inetsoft.graph.coord)
importPackage(inetsoft.graph.guide.form)

var arr = [["State", "Quantity"], ["NJ", 200], ["NY", 300]];
dataset = new DefaultDataSet(arr);
graph = new EGraph();
var elem = new IntervalElement("State", "Quantity");
var form = new ShapeForm();
form.setValues(['NJ',100]);
form.setShape(GShape.FILLED_TRIANGLE);
form.setColor(java.awt.Color(0xff0000));
form.setSize(new java.awt.Dimension(50,50));
graph.addForm(form);
graph.addElement(elem);
| Previous: Create a Chart |
Next: Create a Web Chart
|


