Dashboard Definition
Dashboard software, sometimes referred to as digital dashboards or data dashboards, is often analogized to the dashboard in a car. This analogy is a starting point, but it is far from capturing all the ideas embedded in dashboard software. On a high level, dashboard software is a versatile visual app that converts data into useful information.
Continue reading below to learn more about dashboards
What Are the Benefits of a Dashboard?
Dashboard software's primary benefit comes from its easy-to-understand, easy-to-use nature. When first
presented, most likely in a web app, summarized key performance indicators (KPI) are presented in a single
page. The visual nature of the interactive charts allows users to effortlessly answer the most important
questions.
Some common examples of questions a summary dashboard answers are:
- How many new customers won?
- What products are selling the most?
- Where are marketing leads coming from?
- Is there any relevant trending in social media?
- At what rate is the customer service center responding to and resolving customer issues?
After reviewing KPIs, business users can further benefit from dashboard software's interactive analytic ability. In-place analysis, drilldown paths, and team collaboration are visually driven processes that require no special skills to master.
What is a Dashboard Used For?
Dashboard software is used by executives, managers, analysts and frontline business users for monitoring, reporting, and analysis. Dashboards for different business purposes are commonly created for different target audiences.
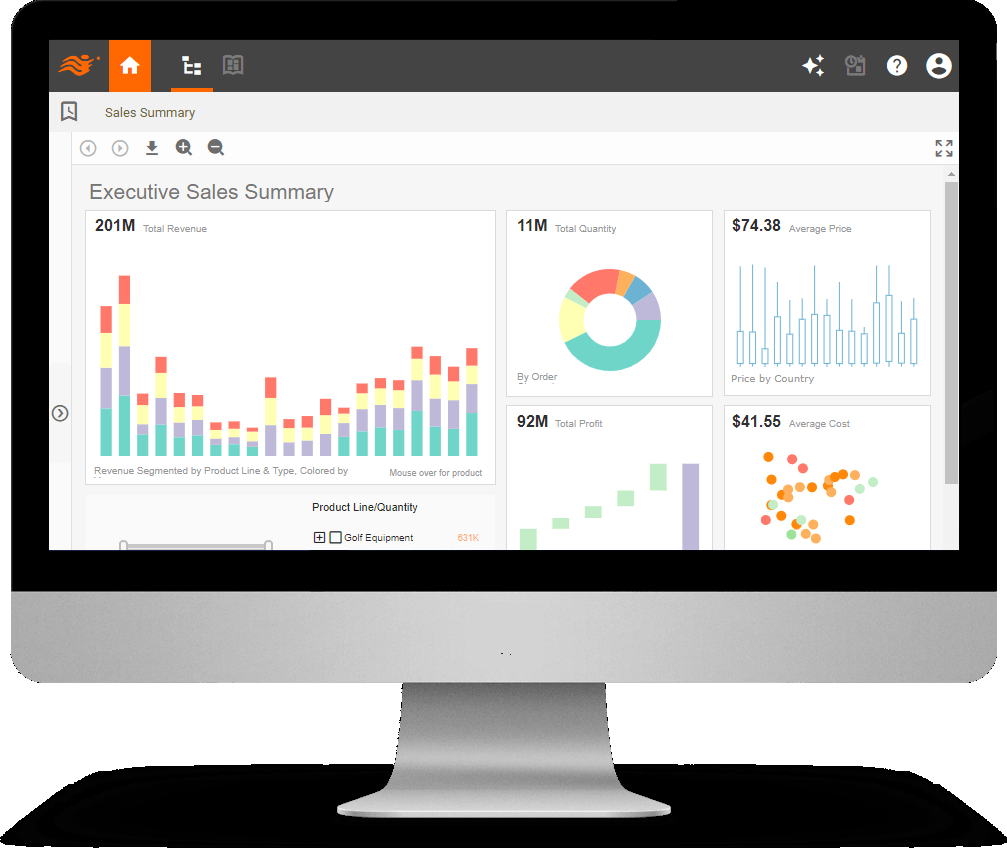
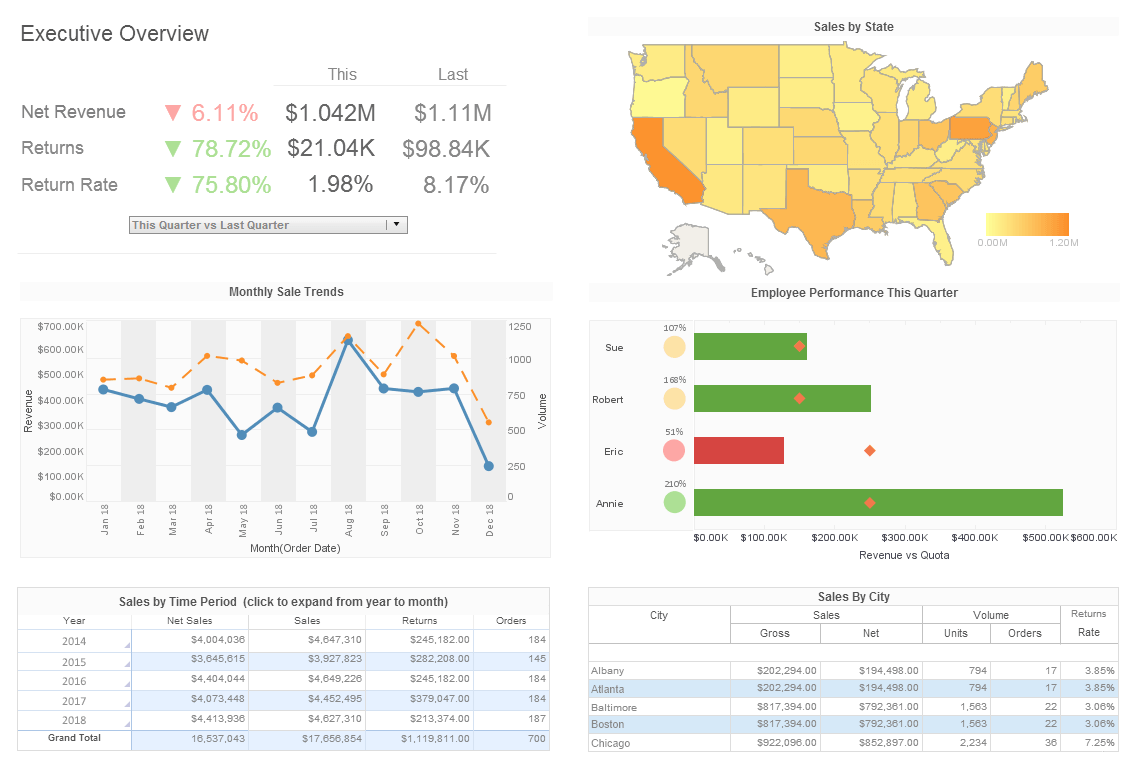
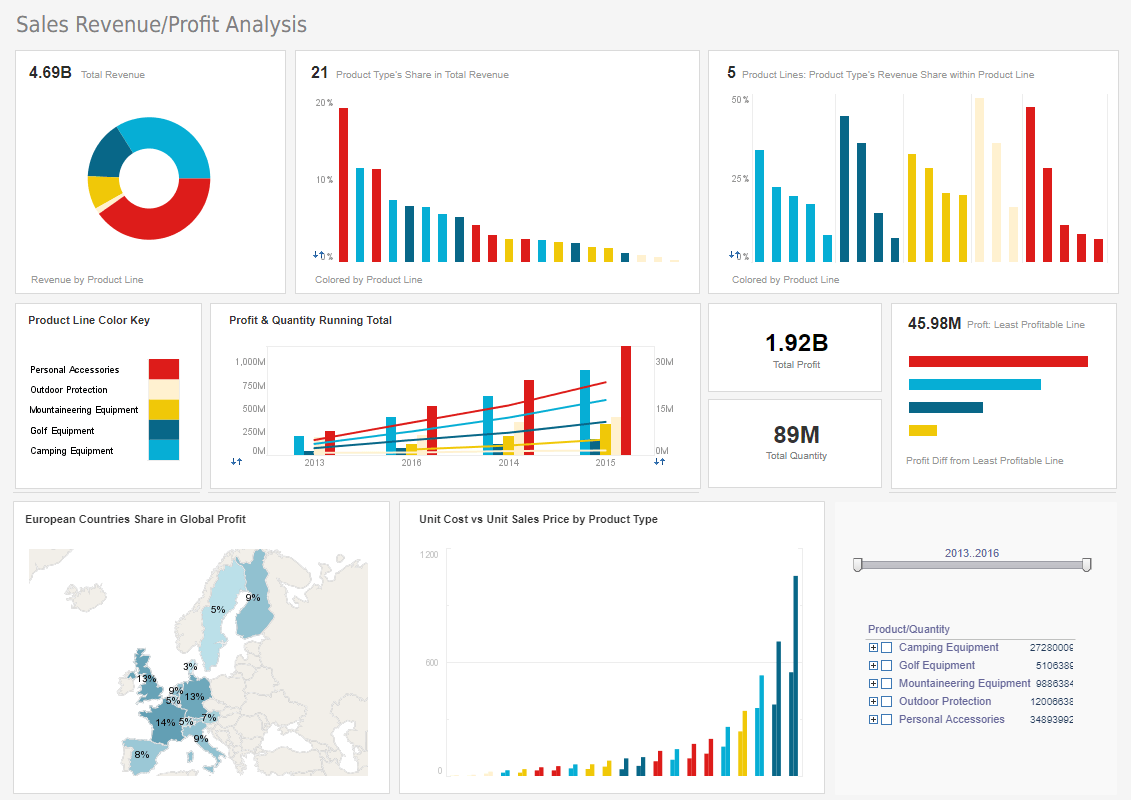
What is an Executive Dashboard?
An executive dashboard, also called a management dashboard, provides an overview of the business at a glance.
Executive dashboards tend to draw data from finance, sales, marketing and operations data sources to present
KPIs in gauges and charts. In-dashboard analysis and drilldown to sub-level dashboards are also important ways
to enable executives to gain a full understanding of the drivers underlying the KPIs.
Interact with a live example of an executive dashboard
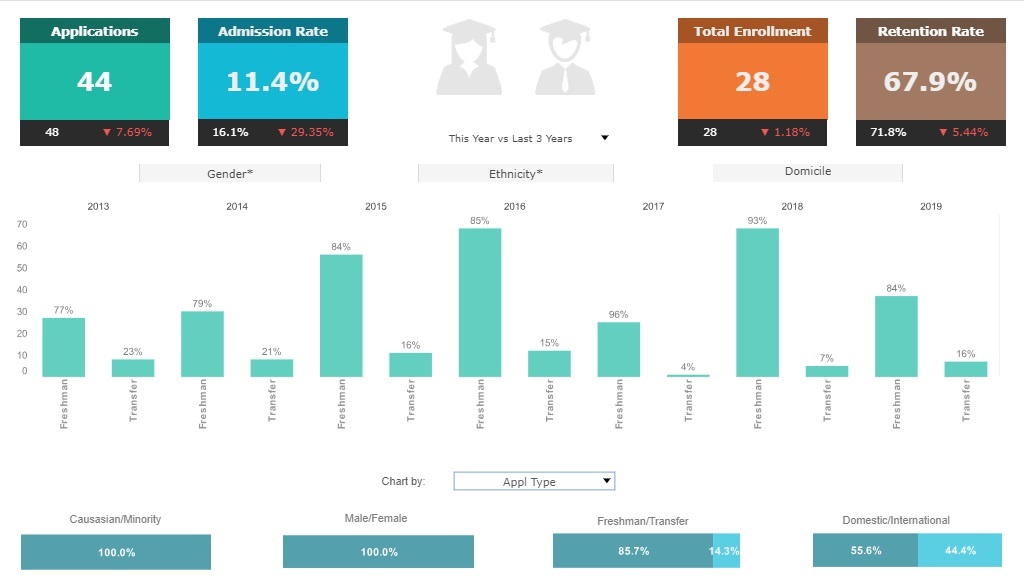
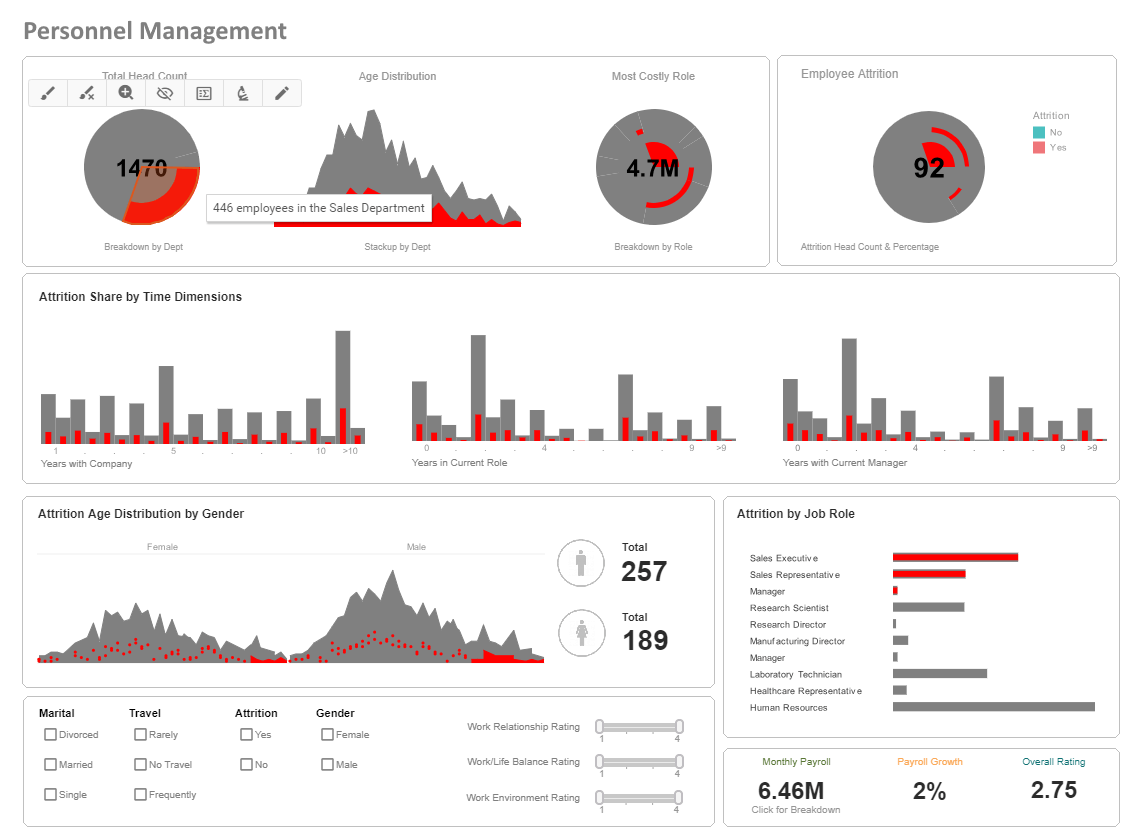
What is a Performance Dashboard?
A performance dashboard's users are executives and managers. The data scope of a performance dashboard
depends on the audience. Built-in performance goals in a performance dashboard distinguish it from other type
of dashboards.
Interact with a live example of a performance dashboard
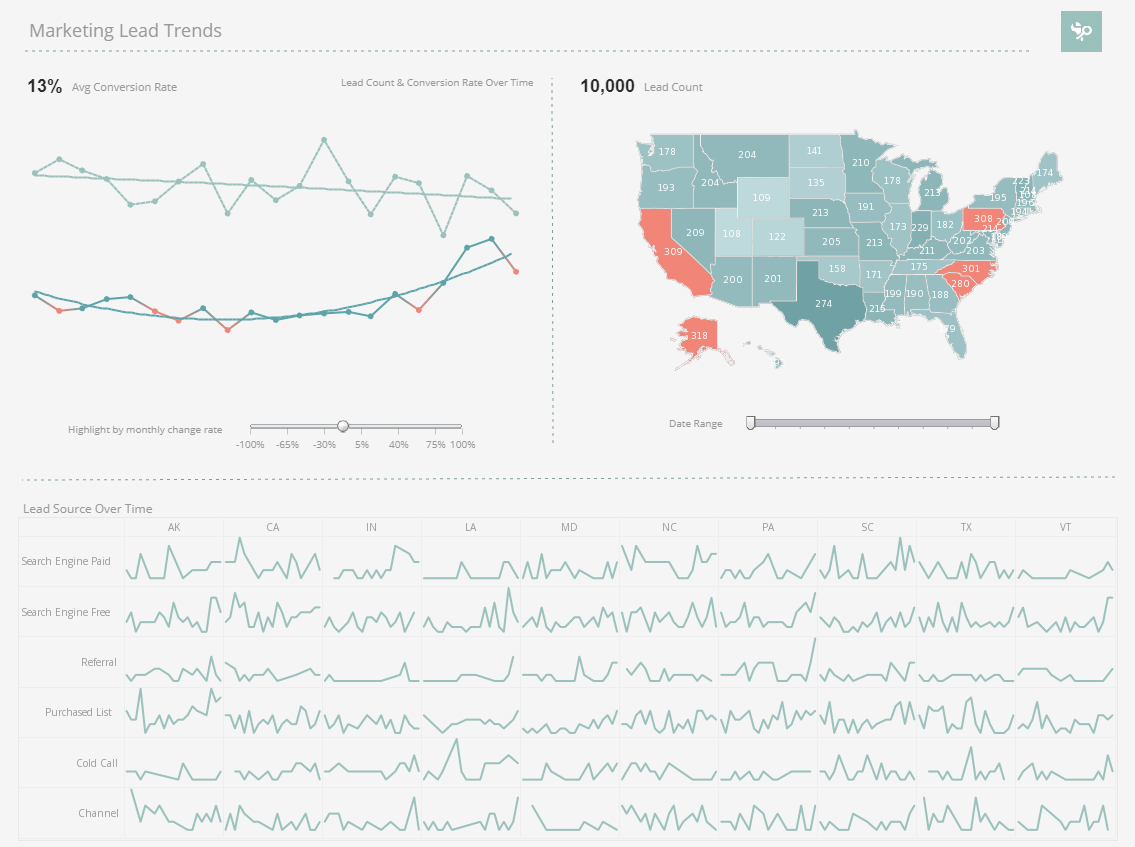
What is a Marketing Dashboard?
In an increasingly cloud-powered marketing environment, marketing dashboards offer the ability to connect,
mashup and analyze a diversified data portfolio. With visualization dashboards, marketers can quickly measure
campaign performance and identify trends.
Interact with a live example of a marketing dashboard
More Dashboard Definitions
What is a Sales Dashboard?
As a business' sales channels become a mixture of online and offline sales, sales dashboards offer managers
a holistic view of their channels, teams and product mixtures. For sales team members, flexible online
dashboards that mashup CRM and other customer data will allow them to quickly push forward deals in the
pipeline.
Interact with a live example of a sales dashboard
What is a Project Dashboard?
A project dashboard is a live dashboard that coordinates timelines and deadlines. As cloud apps
proliferate, project dashboards with Gantt charts are no longer sufficient. They must also connect to live
data from various other app data such as requests and issue tracking. Essentially, a project dashboard
should be display status tracking as well as actionable items.
Interact with a live example of a project dashboard
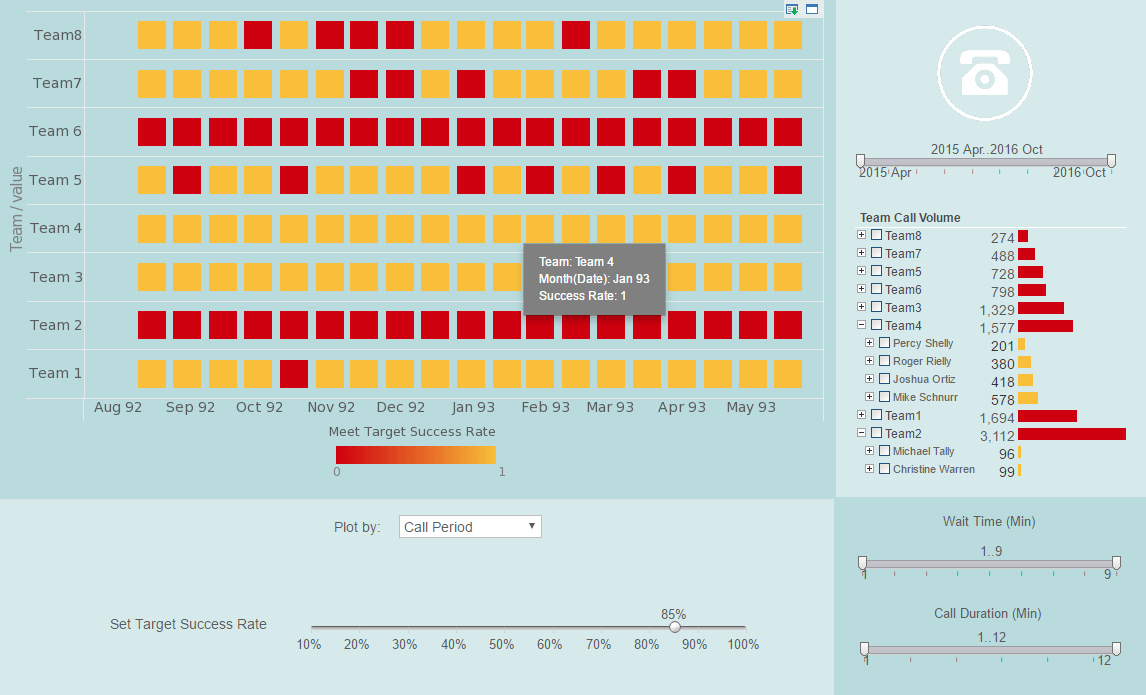
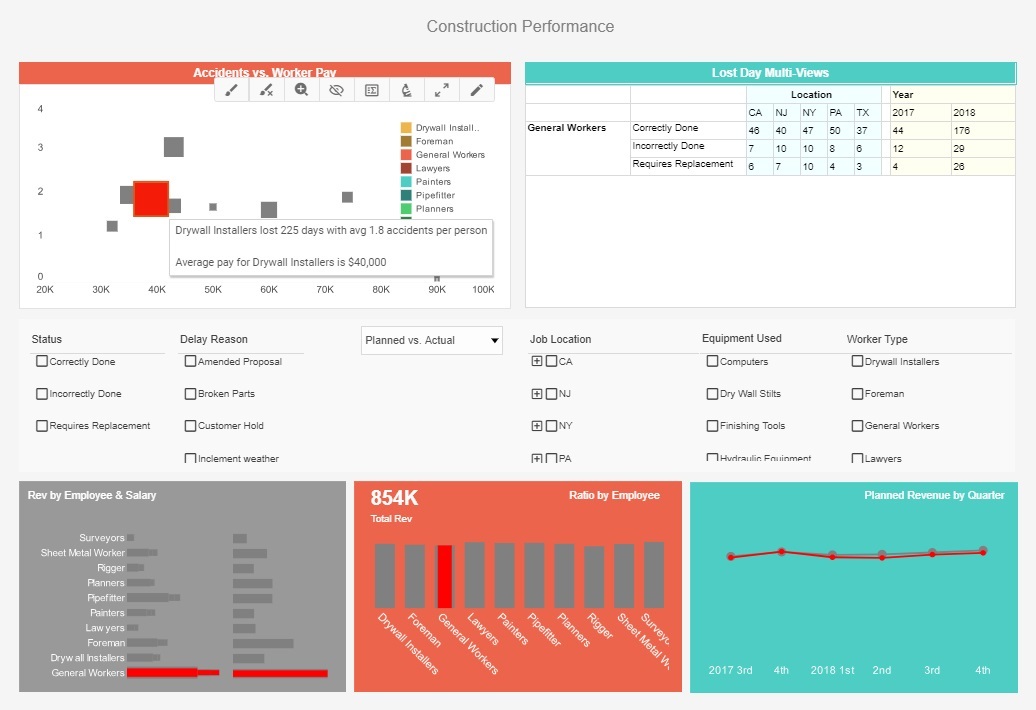
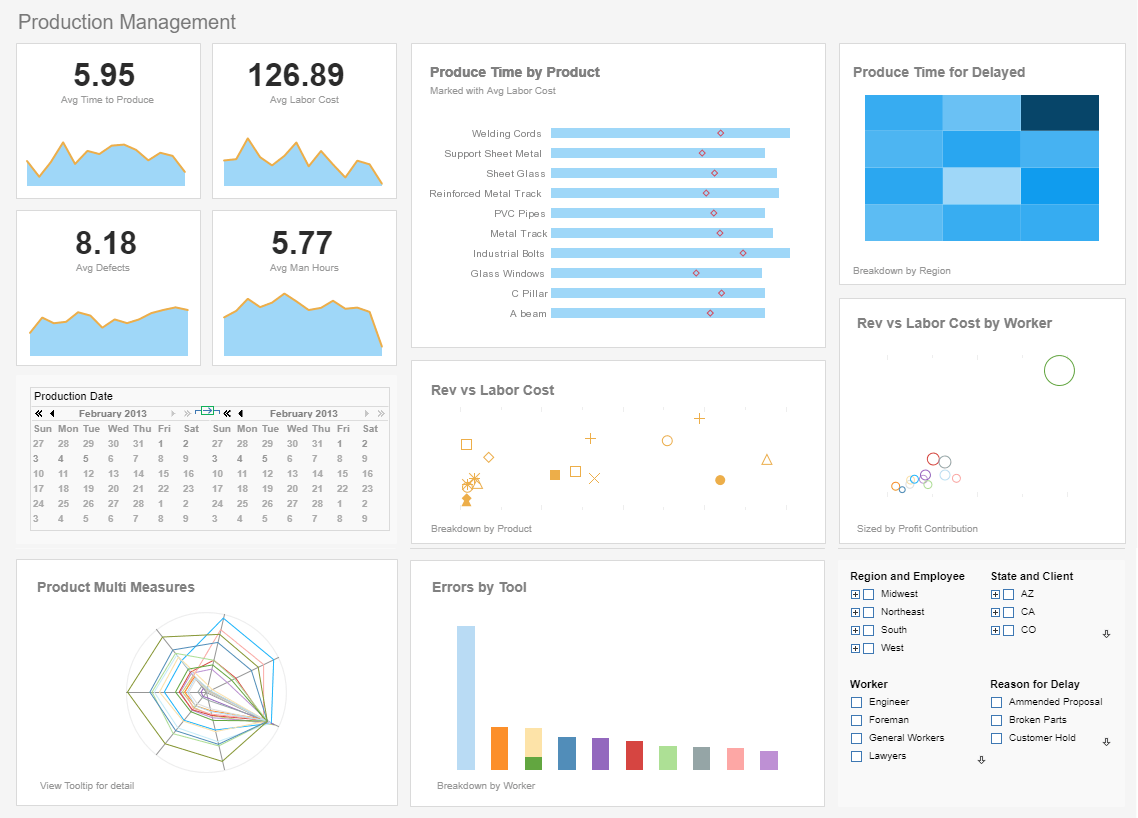
What is a Performance Management Dashboard?
A performance management dashboard ensures a business's processes are running smoothly and efficiently.
These functions can range from accounts receivable management in Finance to call center management in
Customer Service. Performance management dashboards often need to be live dashboards where visual components
are continuously updated with fresh data automatically.
Interact with a live example of a performance management dashboard
What is an Asset Management Dashboard?
An asset dashboard helps enterprise asset managers track asset statuses as well as associated work. For
example, an inventory dashboard is one type of asset management dashboard. As enterprise assets consist of
physical assets as well as digital assets, an asset dashboard must be able to tap into widely different data
sources.
Interact with a live example of an asset dashboard
What are the Different Types of Dashboards?
The usage scenario of dashboard application dictates its type. Answering these questions can help pinpoint the type:
- Who are the primary consumers for the dashboard?
- What data is necessary and how many data sources are connected?
- How many dashboards will satisfy different audiences?
- What usage pattern do the different user groups have?
What is a KPI dashboard?
A KPI dashboard focuses on Key Performance Indicators with a high level summary. Because executives and
managers depend on multiple KPIs, KPIs should be presented with minimum visual interference. For example,
labels should be shown via mouse-overs so that the gauge or chart is easily read. However, interaction and
drilldown must be enabled so that the users can easily dig deeper and learn the details.
Interact with a live example of a KPI dashboard
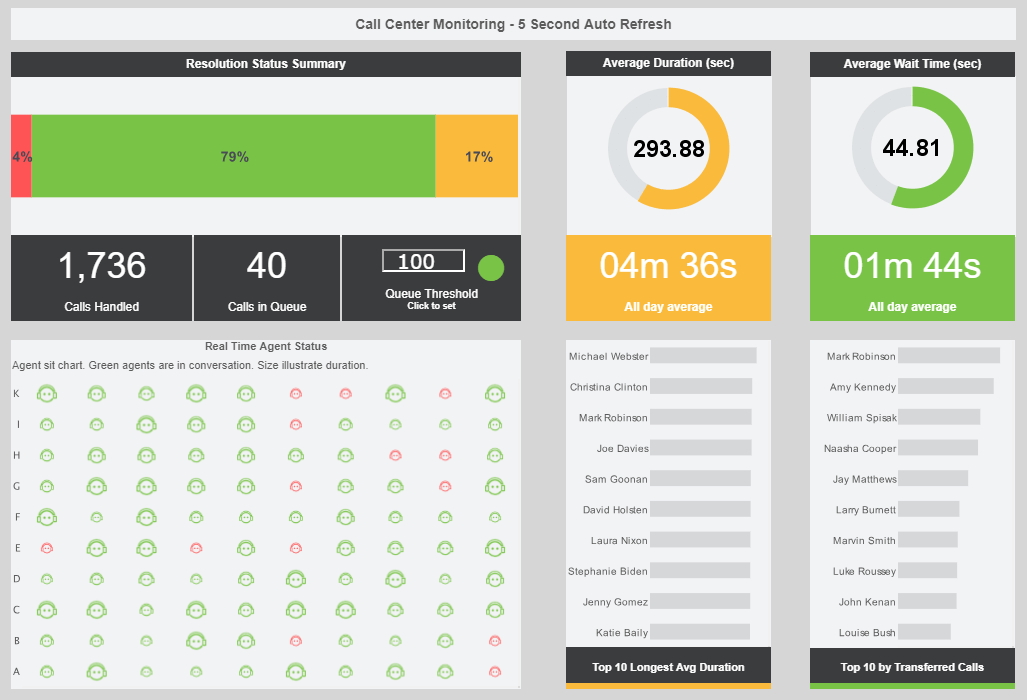
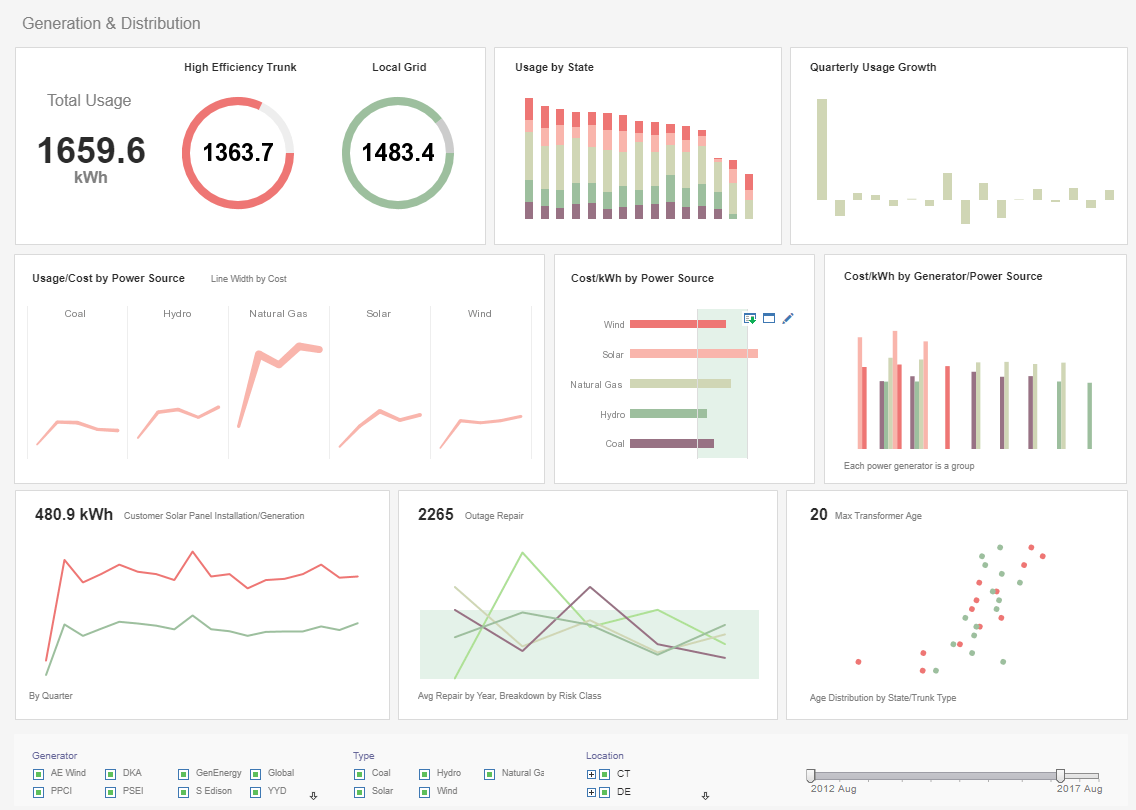
What is a Monitoring Dashboard?
A monitoring dashboard is most often a live dashboard. Sometimes, such a live dashboard is displayed on large
monitors, sometimes called TV dashboards. Besides live data updates, multiple monitoring dashboards are often
shown in a loop when visual real estate is limited. Stakeholders also need to have the ability to access the
monitoring dashboards from various devices such as mobile phone and desktops. When issues are indicated,
responsible parties need to be able to interact and drilldown to address the anomalies.
Interact with a live example of a monitoring dashboard
What is an Analytic Dashboard?
An analytic dashboard focuses on rich interactive functions. For example, a time-based comparison such as
this year vs previous year is a common and simple analytic function. Furthermore, it is critical for an
analytic dashboard to allow access to lower data layers so that ad hoc data analysis is possible.
Interact with a live example of an analytic dashboard
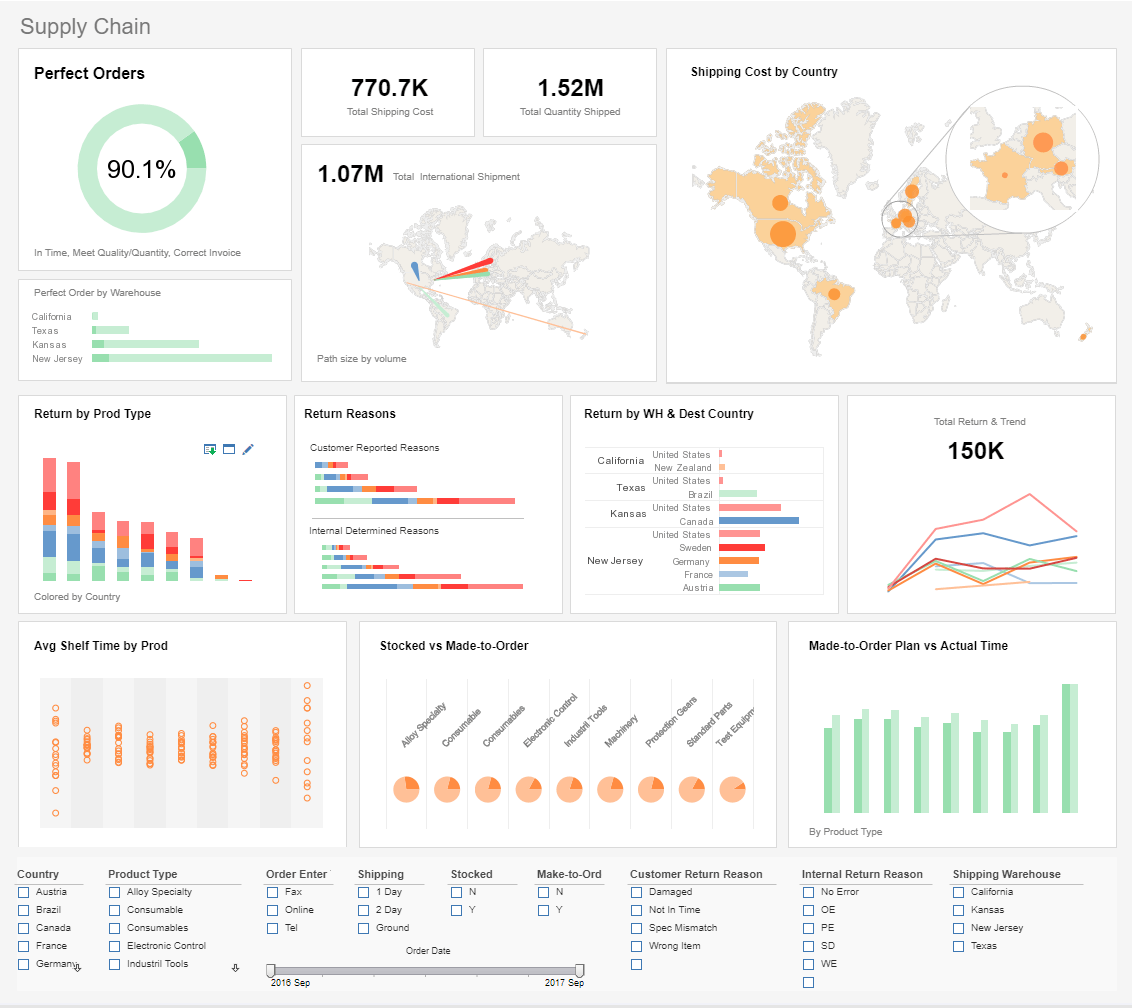
What is an Operational Dashboard?
An operational dashboard replaces many traditional reporting functions. It's often utilized by a wide range
of frontline business users in their daily operation. Detail level data access is crucial for an operational
dashboard. For example, a marketing associate can use an operational dashboard to prioritize daily leads to
follow-up with.
Interact with a live example of an operational dashboard
What is the Difference Between Business Intelligence (BI) and Dashboarding?
Business intelligence software encompasses technology that stores, transforms and mashes up raw data into
actionable, information for business users. A traditional BI environment roughly consists of data
warehouses, ETL (extraction, transformation and loading data) processes, and analytic and reporting tools.
Dashboard software can be classified as dashboard apps and the dashboard platform.
What is a Dashboard App?
A dashboard app serves as the visual layer of BI. When data is small and well organized for reporting, a dashboard app could be sufficient. Otherwise, it relies on other BI tools to do the heavy lifting data work.
What is a Dashboard Platform?
A dashboard platform goes beyond the visual layer. It also compresses data warehouse and ETL functions into a light-weight platform for agile deployment. This compact platform reduces technical skill requirements and empowers business users with rich self-service via visual dashboards.