What Is Location Intelligence?
Below is the transcript from a podcast from InetSoft Technology. The speaker is Mark Flaherty, CMO at InetSoft.
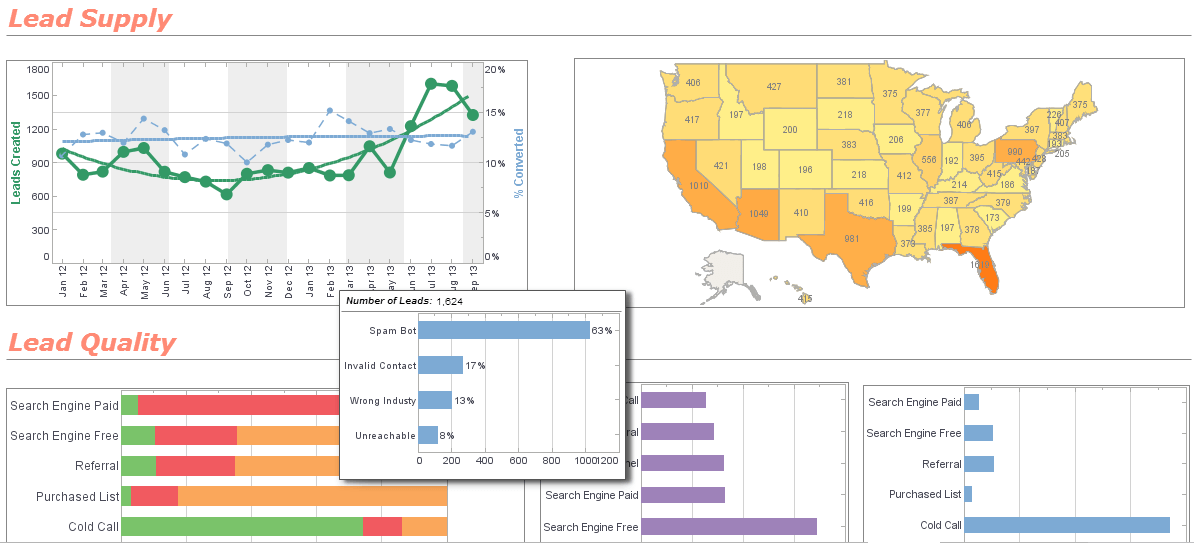
Many organizations have come to realize the power of “where” when visualizing data. Industry analysts have estimated that 80% of enterprise data contains some type of location data, whether it is address, postal code, city boundary, or some other geographical area like store number, sales trade area, branch district or distribution zone.
This dimension of the data lends itself to powerful visual analysis, especially when mashed up with other data such as that which is stored in a data warehouse. InetSoft's BI solution includes geographic visualization and analysis tools in addition to a robust BI platform. It puts advanced mapping and spatial visualization functionality into the hands of anyone who can use a BI application. The combination helps customers maximize ROI.| #1 Ranking: Read how InetSoft was rated #1 for user adoption in G2's user survey-based index | Read More |
What are some examples of how location enhances business intelligence?
Location information is valuable to most organizations, but it becomes critical to organizations where geography has a dramatic impact on business operations, such as in the areas of marketing, planning, asset tracking, resource assignments, and the delivery of services.
Understanding how location impacts your organization is important. It can give a company a powerful competitive advantage in their market. Spatial analysis answers questions that are “where” related. In addition to the traditional “who,” “what,” “when,” “how much” questions that traditional BI answers in order to help people become effective making decisions, location intelligence adds the “where” component.
What is a customer example of location intelligence?
An insurance customer of ours uses geographic analysis tools to aggregate and analyze risk based on proximity to events such as floods, hurricanes, or potential terrorist targets. The risk analyst in those organizations are accurately reporting the accumulated risk by geographic area. From there they are calculating the probable maximal loss based on modeled events. They then take action by either making better underwriting decisions or possibly offsetting their risk through re-insurance. By doing this they are lowering their exposure to catastrophic events.
On the retail side their executives in sales and marketing are able to monitor performance at the store level, track marketing or direct mail campaigns, view inventory levels, or analyze sales effectiveness across geographies. This gives them ability to quickly respond to regional trends and increase their operational efficiency.
How Does the Bureau of Indian Affairs Use Location Intelligence?
The Bureau of Indian Affairs (BIA) plays a crucial role in managing and supporting Native American lands, resources, and communities. Given its responsibility for overseeing over 55 million acres of tribal land, location intelligence - the ability to analyze geographic and spatial data - has become a key tool in the agency's decision-making processes. By leveraging GIS (Geographic Information Systems), satellite imagery, and real-time mapping tools, the BIA improves land management, resource allocation, infrastructure development, and emergency response efforts.
1. Land and Resource Management
One of the primary ways the BIA uses location intelligence is in tracking and managing tribal lands. Geographic Information Systems (GIS) allow the agency to create detailed maps that highlight land ownership, natural resources, and land-use patterns. This is critical for ensuring that tribal governments and the federal government have accurate records of land boundaries, property rights, and leasing agreements. GIS tools also help in planning for sustainable land use, whether for agriculture, energy production, or conservation efforts.
2. Infrastructure and Community Planning
The BIA supports the construction and maintenance of roads, schools, housing, and public facilities in Native American communities. Location intelligence helps identify optimal sites for new developments while considering environmental impact, population density, and proximity to essential services. By integrating satellite imagery and demographic data, the agency can prioritize infrastructure projects in underserved or high-need areas.
3. Environmental and Natural Resource Protection
Tribal lands contain rich ecosystems and vital natural resources, including forests, water bodies, and wildlife. The BIA uses remote sensing and GIS-based monitoring systems to track deforestation, soil degradation, and water resource availability. Location intelligence also helps in detecting illegal activities, such as unauthorized land use or environmental violations, by providing real-time monitoring of protected areas.
4. Emergency Response and Disaster Management
Location intelligence plays a crucial role in disaster preparedness and response efforts for tribal communities. The BIA, in collaboration with FEMA and tribal emergency agencies, uses GIS technology to map areas prone to wildfires, floods, and severe weather events. By analyzing geographic patterns of past disasters, the agency can predict future risks and develop evacuation plans, resource distribution strategies, and emergency response coordination efforts.
5. Law Enforcement and Public Safety
The BIA's Office of Justice Services (OJS) provides law enforcement support to tribal lands, and location intelligence helps map crime hotspots, track patrol routes, and deploy resources more effectively. By integrating spatial data with crime statistics, law enforcement agencies can enhance public safety by improving response times and identifying patterns of criminal activity.
6. Economic Development and Tribal Enterprises
Supporting economic growth in tribal communities is a key mission of the BIA. Location intelligence helps identify business opportunities by mapping key economic indicators, such as tourism potential, trade routes, and natural resource availability. For example, GIS can help tribes identify prime locations for eco-tourism, renewable energy projects, or commercial developments based on population trends and infrastructure access.
7. Cultural and Historical Preservation
Many Native American lands contain sacred sites, historical landmarks, and archaeological treasures. The BIA uses location intelligence to document, protect, and manage these cultural assets, ensuring that development projects do not disrupt sites of historical or religious significance. GIS mapping also aids in preserving indigenous knowledge and traditional land-use practices by incorporating oral histories and tribal expertise into spatial databases.

