StyleBI Business Intelligence Video Training
Training videos are selectively produced for commonly used or advanced functions. You can jump to the visualization & reporting section and data preparation section with following links:
Data Pipeline Training
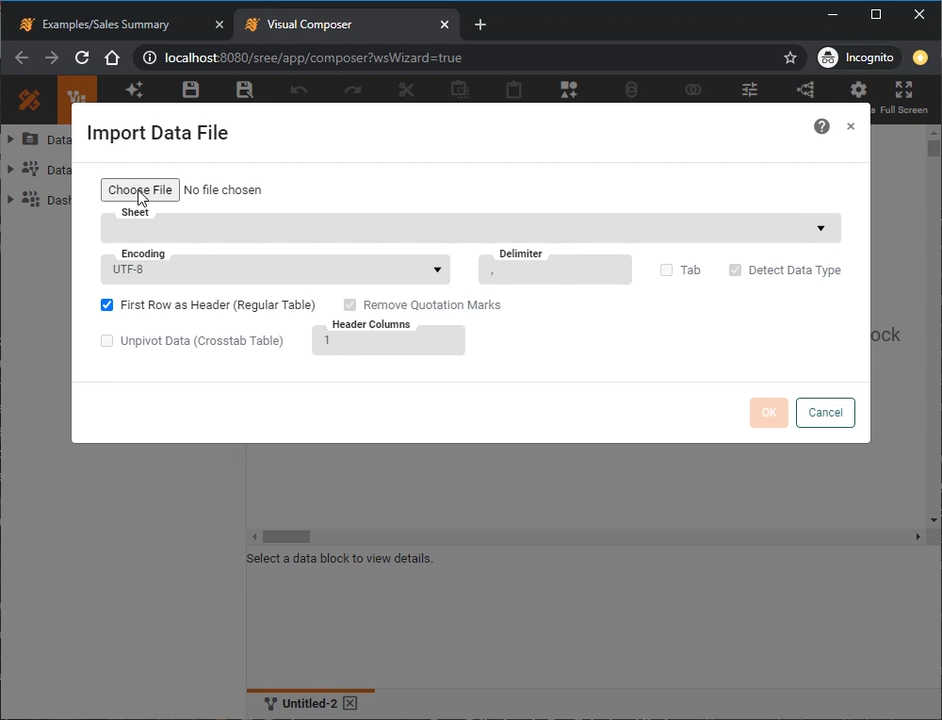
Upload Data
Learn how to upload data into an embedded table and edit it. Accompanying documentation here
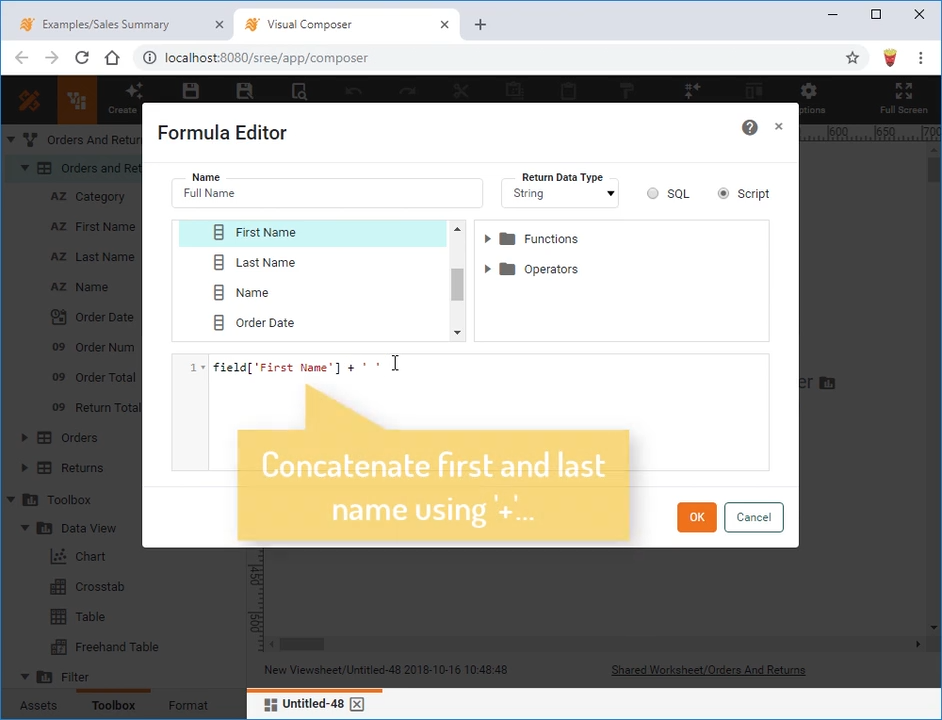
Create a New Data Field
Learn how to create a calculated field at the dashboard level, built on detail or aggregate data. Accompanying documentation here
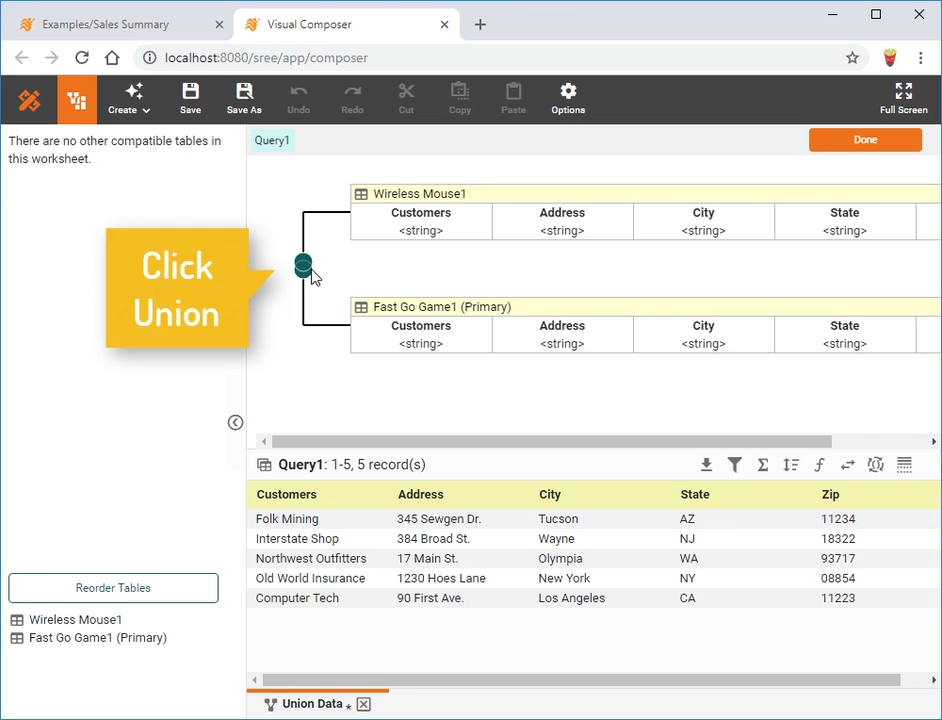
Change a Concatenation
Learn how to switch between the different concatenation types. This video covers union, intersection, and minus concatenations. Accompanying documentation here
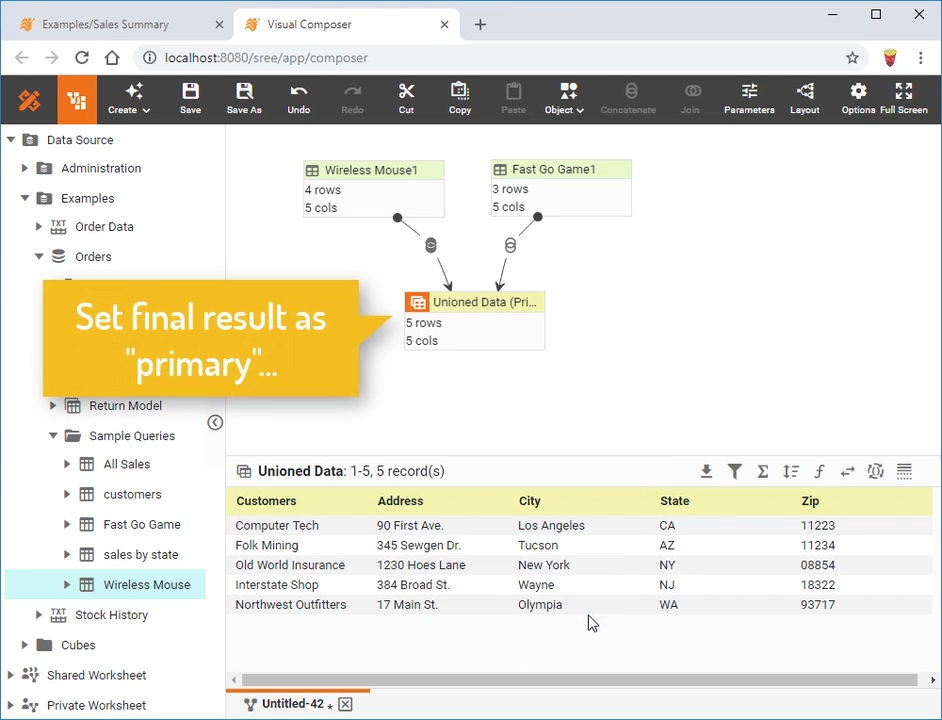
Create a Union
Create a union between two or more data blocks in a Data Worksheet. Accompanying documentation here
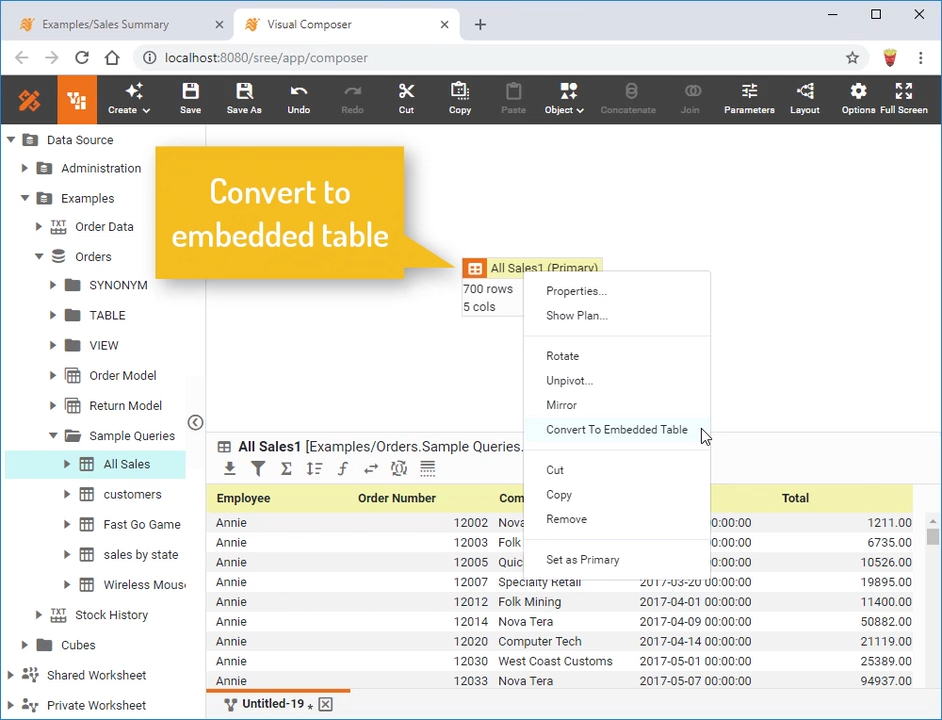
Convert to Embedded Data
Convert a regular data block (which queries a data source) to an Embedded Table whose data is saved together with the Data Worksheet. Accompanying documentation here
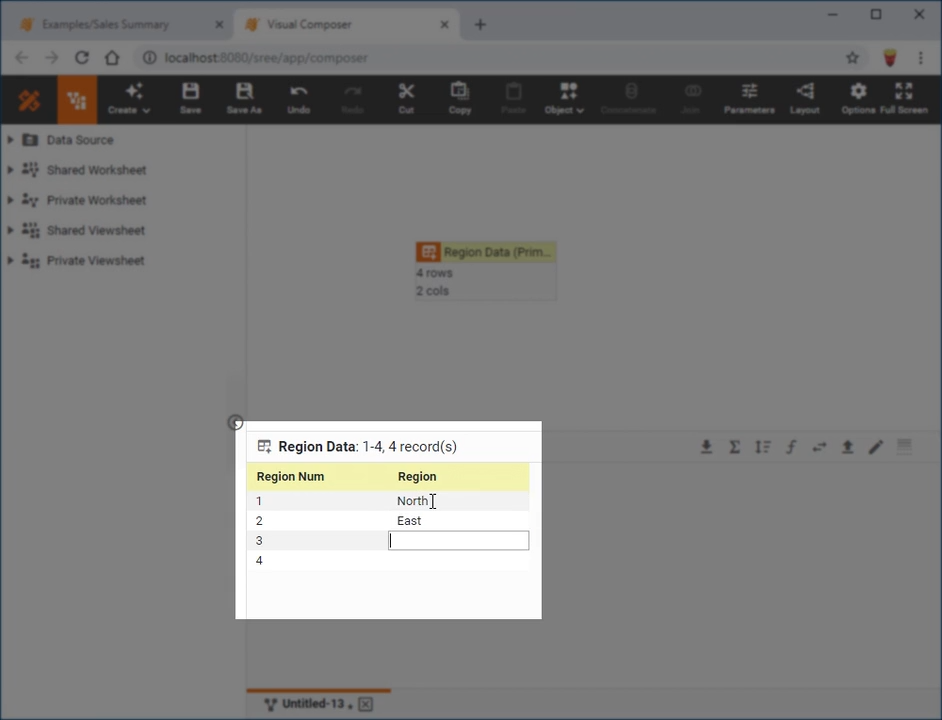
Enter Embedded Data
Manually type data into a data block to be saved with the Data Worksheet. Accompanying documentation here
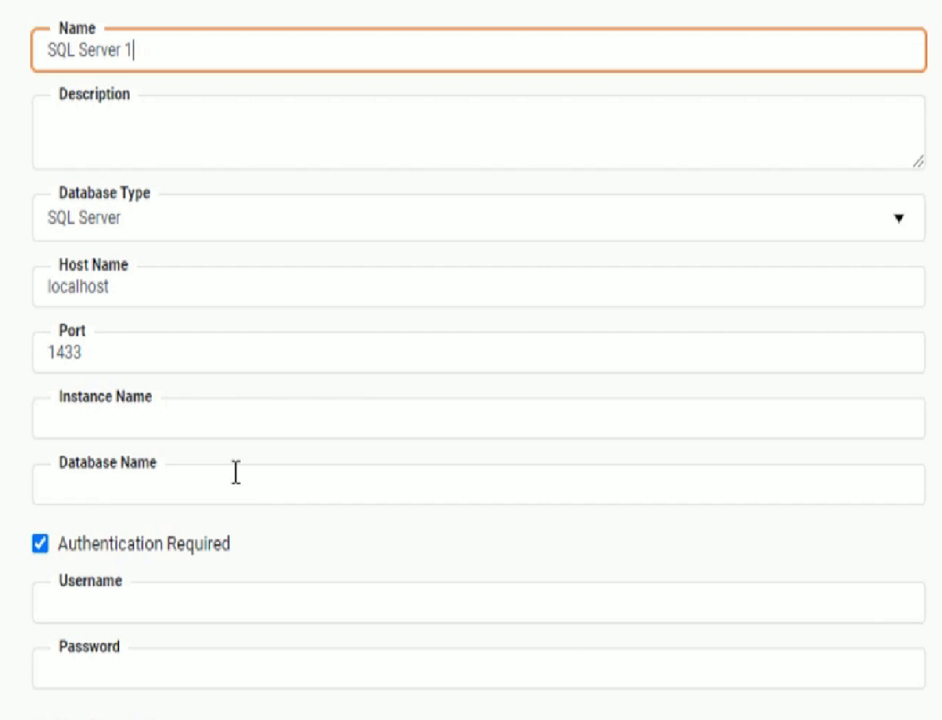
Connect to a Database
Connect to relational (JDBC) database such as SQL Server, Oracle, MySQL, DB2, Sybase, Informix, PostgreSQL, Access. Accompanying documentation here
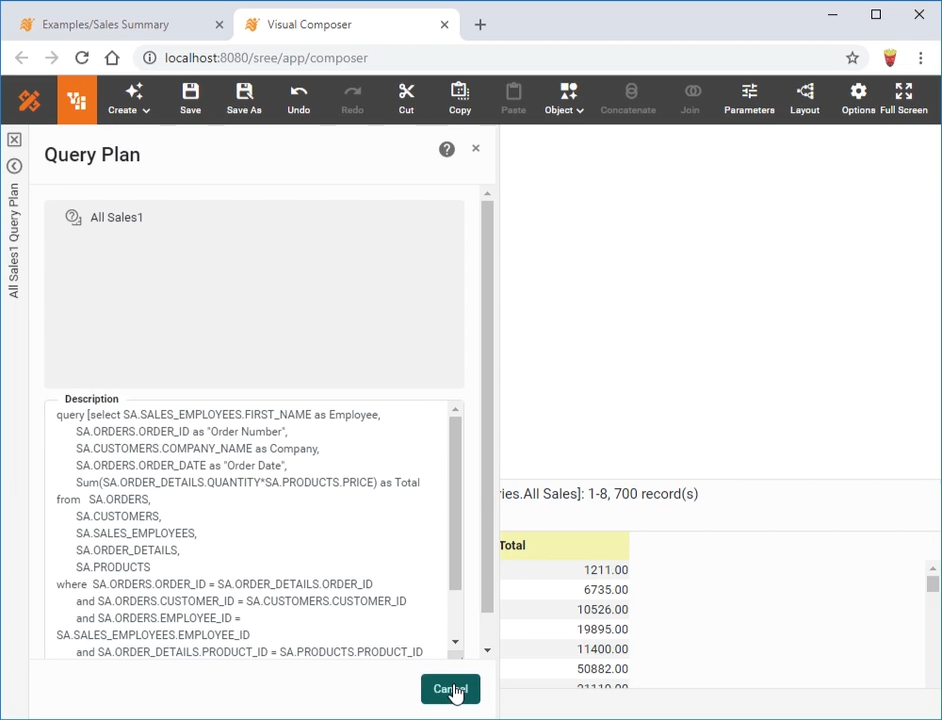
Create a Data Set
Create a new Data Worksheet by constructing a data block from a database table, query, or data model. Accompanying documentation here
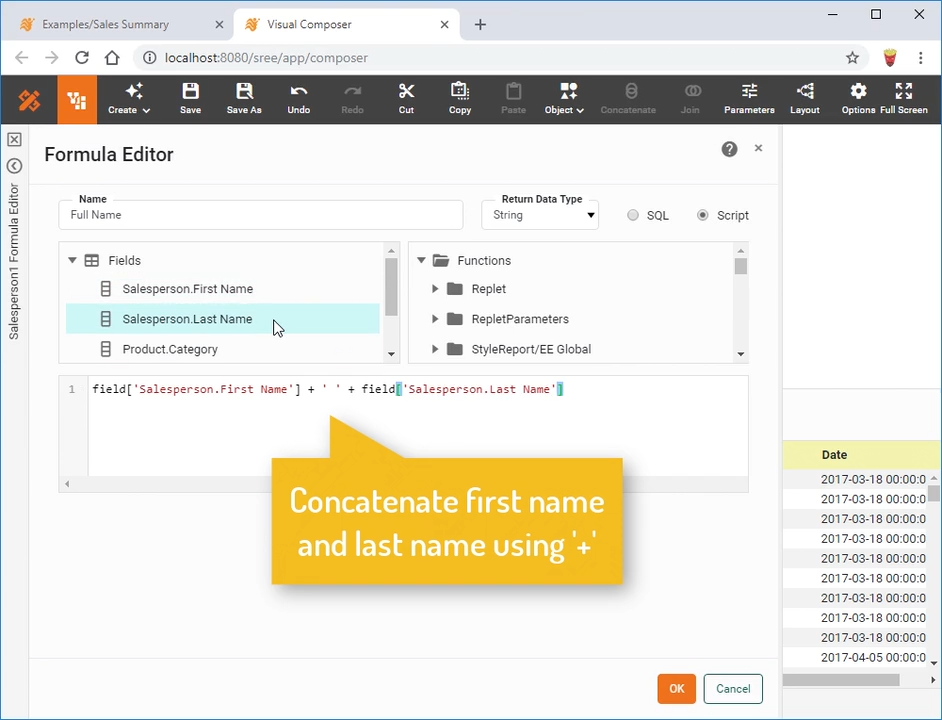
Create a New Data Field
Add a new (derived) data field to a data block in a Data Worksheet by writing a SQL or JavaScript expression. Accompanying documentation here
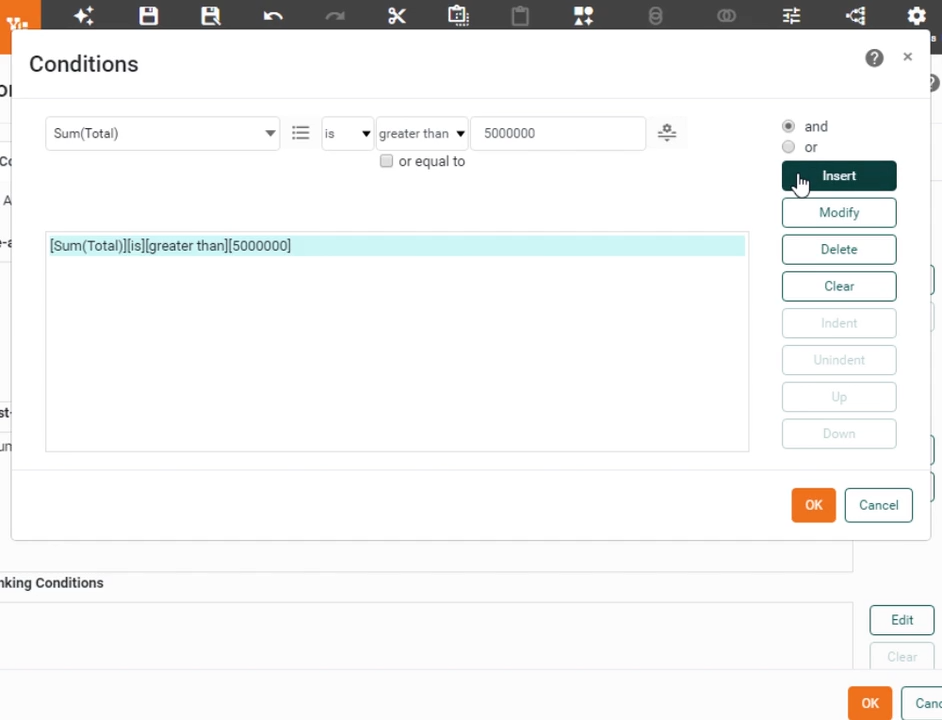
Filter Aggregate Data
Filter grouped and aggregated data in a Data Worksheet. Accompanying documentation here
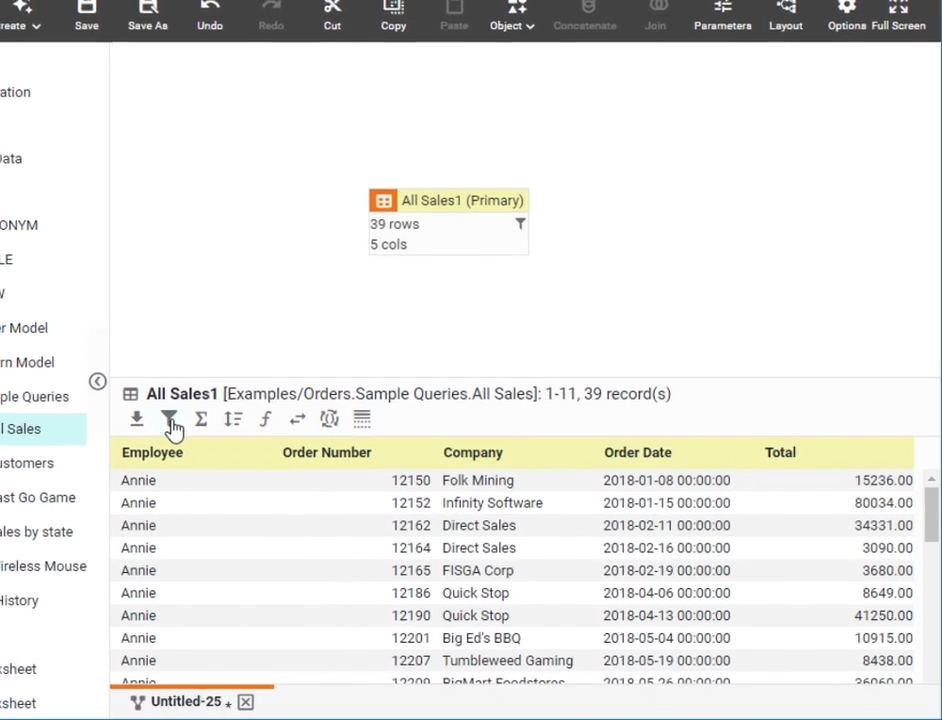
Filter Detail Data
Filter detail data (prior to grouping and aggregation) in a Data Worksheet. Accompanying documentation here
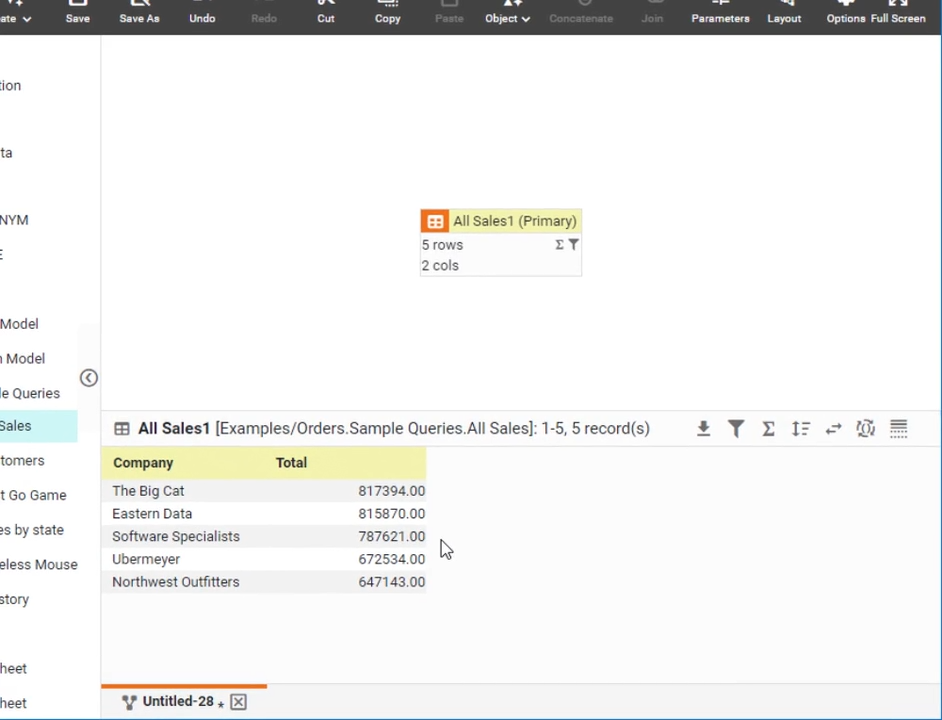
Filter Top or Bottom Data
Filter the top or bottom groups (or individual records) based on a measure value in a Data Worksheet. Accompanying documentation here
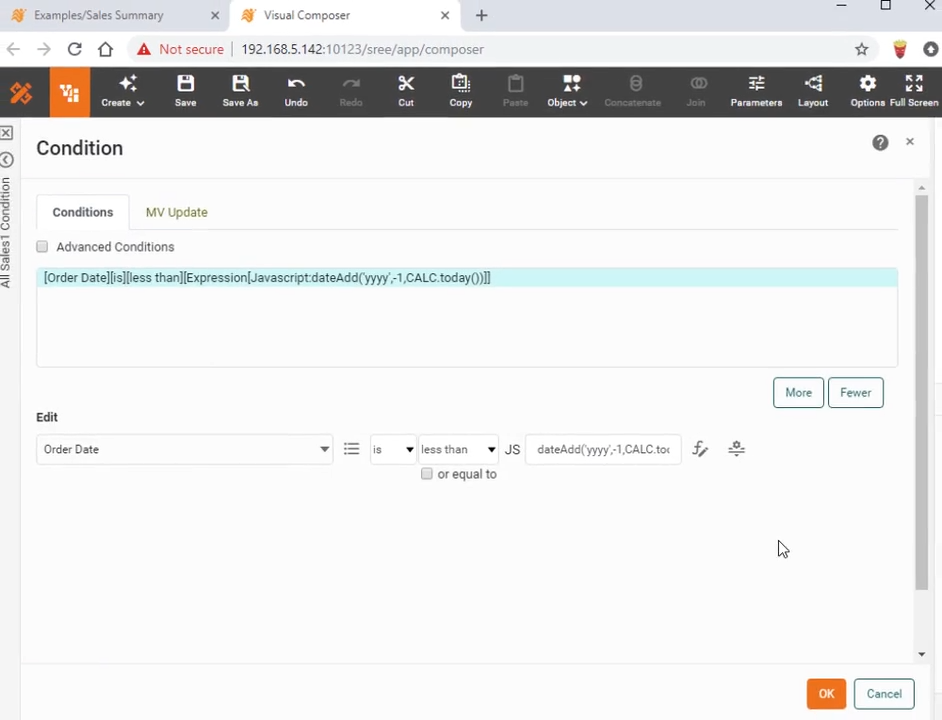
Filter Data using an Expression
Filter data using a JavaScript or SQL expression (formula) as part of the condition. Accompanying documentation here
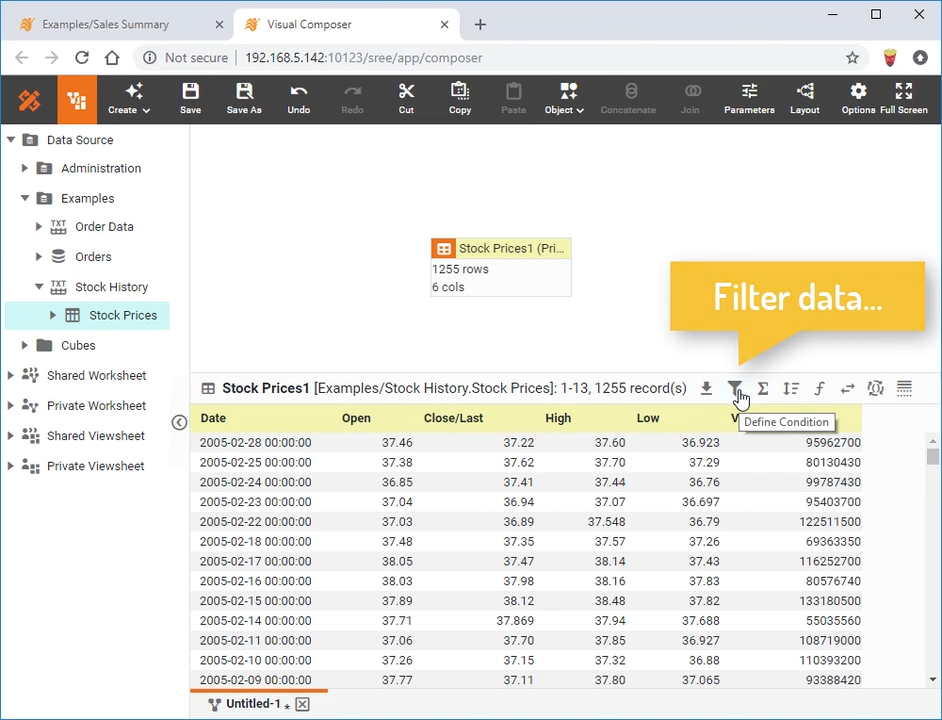
Filter Data using a Field Comparison
Filter data by using a comparison between columns in the data block.. Accompanying documentation here
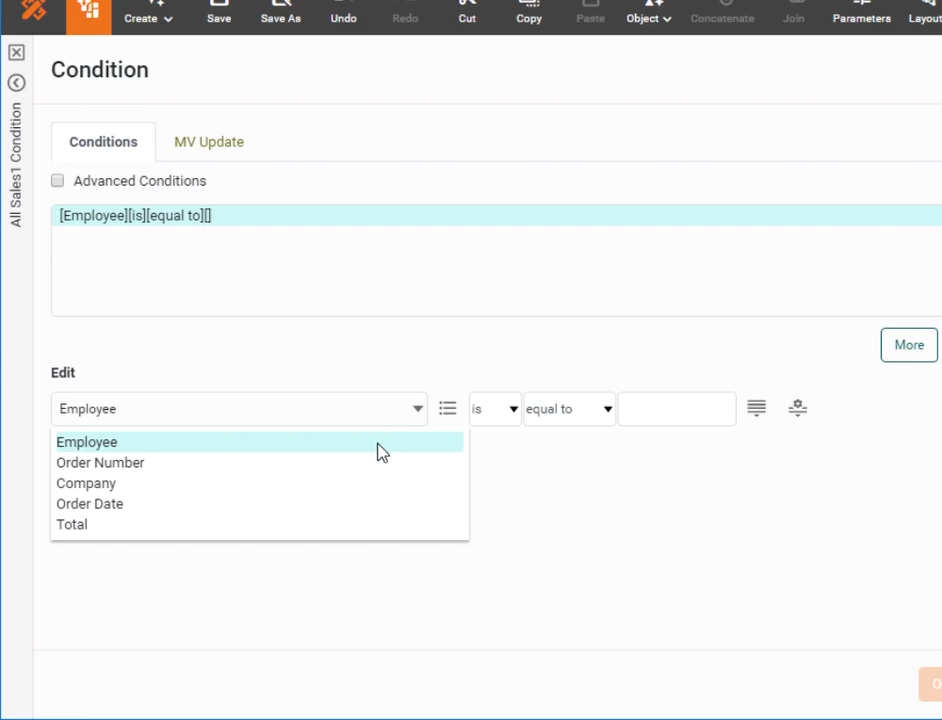
Filter Data using Session Information
Filter data in a data block (in a Data Worksheet) using login session information, such as the user's name, group, or role. Accompanying documentation here
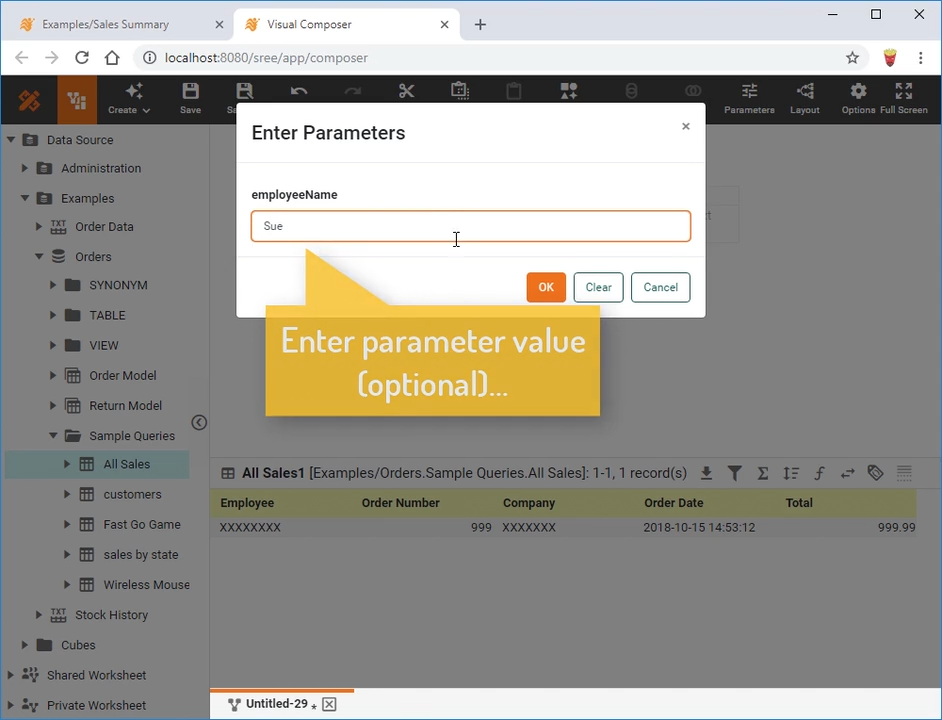
Filter Data using Parameters
Filter Data in a data block (in a Data Worksheet) by using parameterized conditions; that is, conditions that rely on user-defined or script-defined variables. Accompanying documentation here
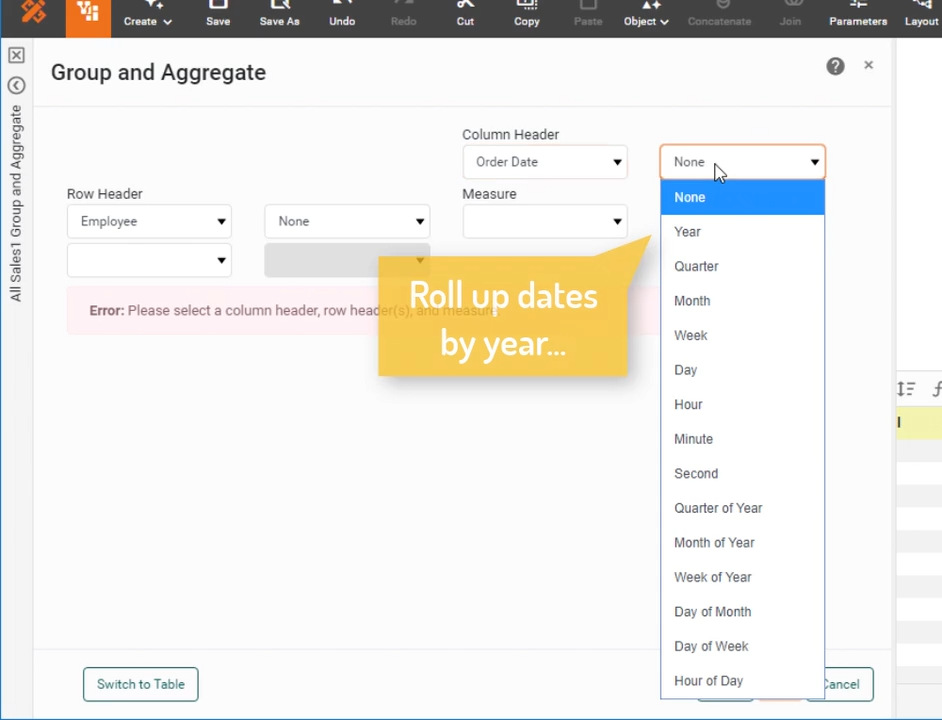
Group and Aggregate Data in a Crosstab
Group and aggregate data by using a crosstab data block in a Data Worksheet. Accompanying documentation here
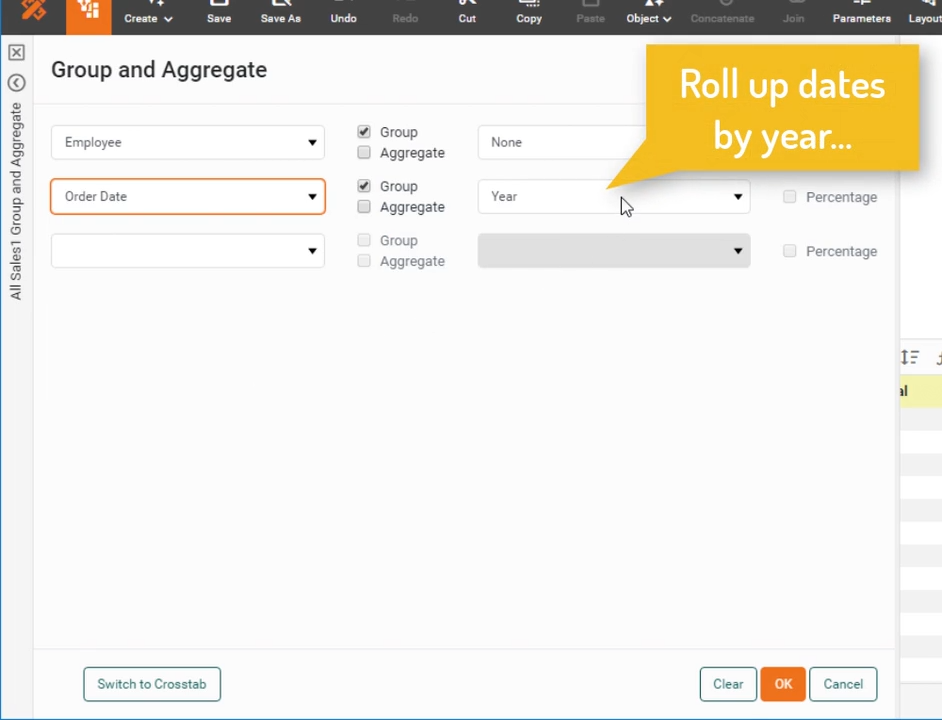
Group and Aggregate Data
Group and aggregate data in a data block (in a Data Worksheet). Accompanying documentation here
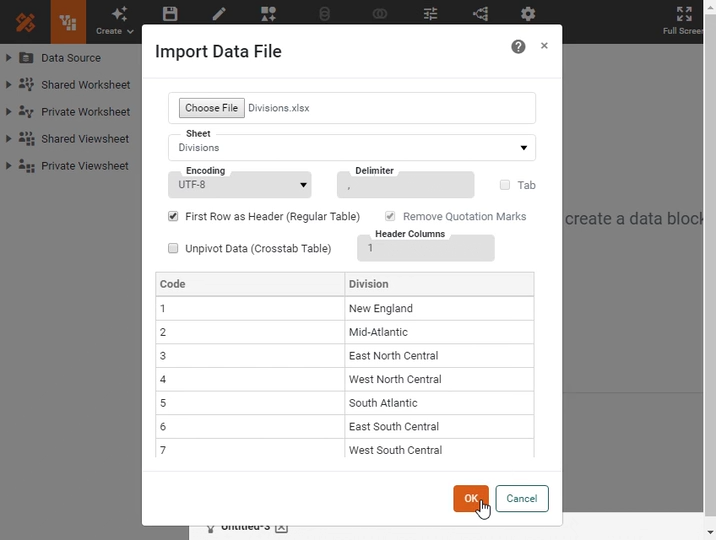
Import Data
Import data into a data block in a Data Worksheet. Imported data can be edited within the Worksheet, and is saved together with the Worksheet. Accompanying documentation here
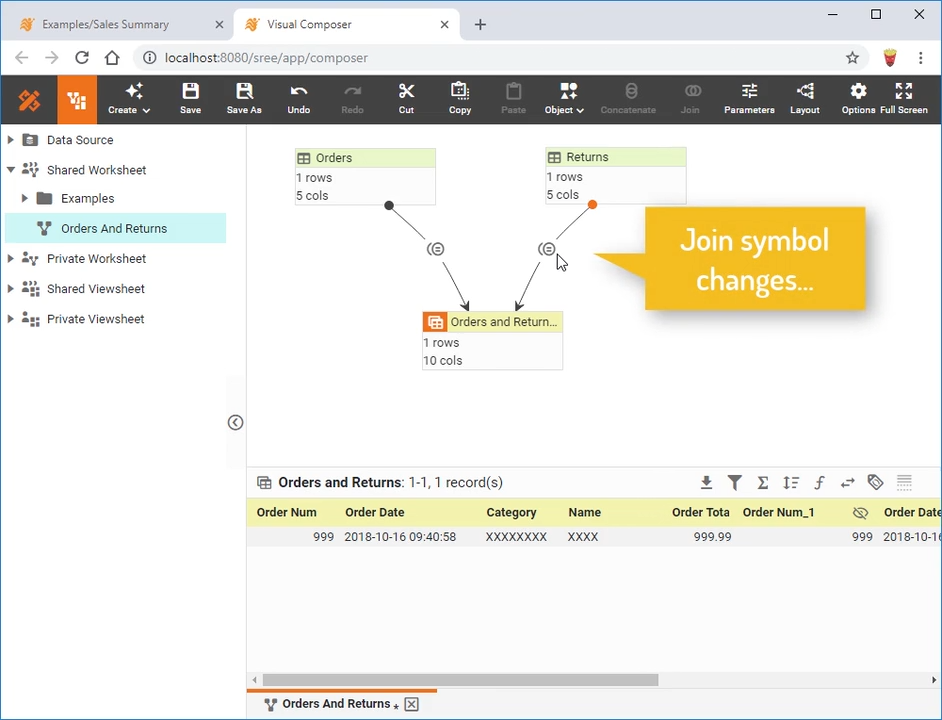
Change a Join
Change the type of a join from "inner" to "outer" or "inequality". Accompanying documentation here
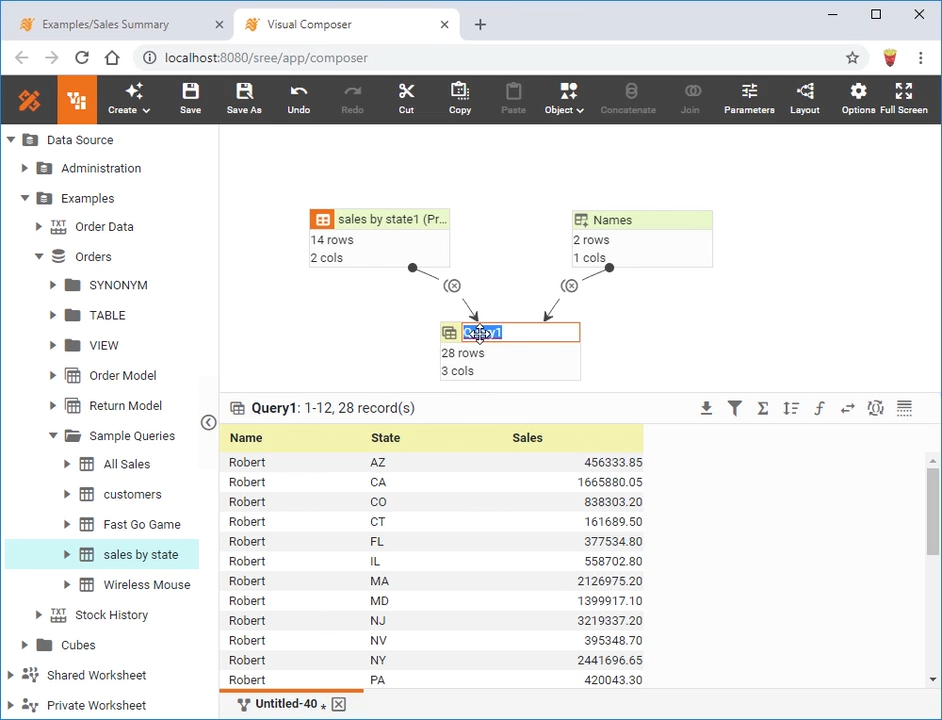
Create a Cross Join
Create a cross join or Cartesian join between two data blocks in a Data Worksheet. The resulting cross join data block contains every combination of records from the two data blocks. Accompanying documentation here
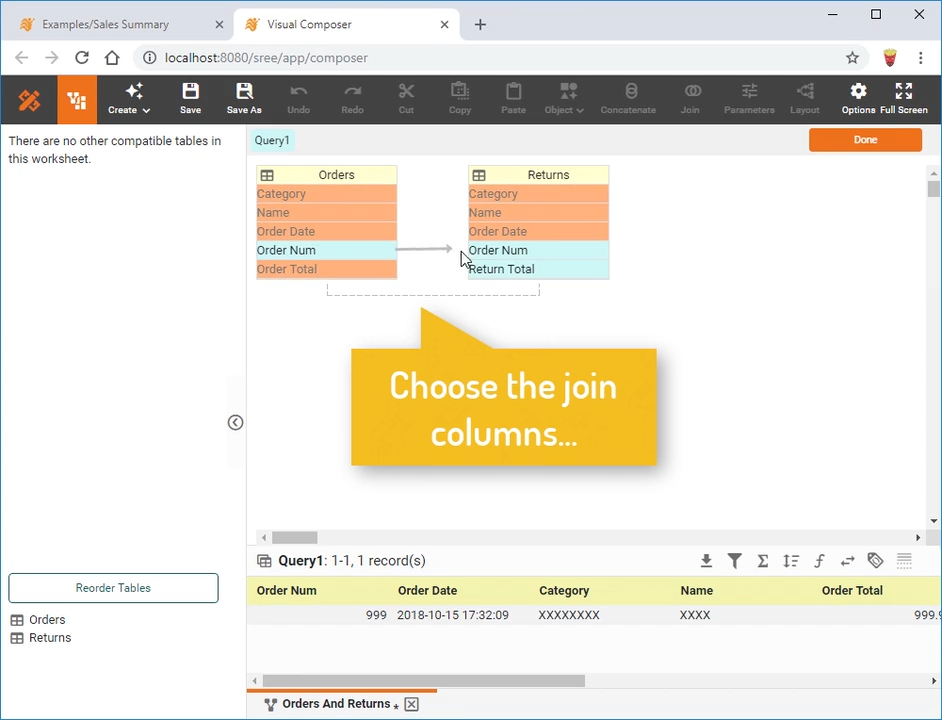
Create an Inner or Outer Join
Create an inner join or outer join between two data blocks in a Data Worksheet. Multiple join columns can be specified. Accompanying documentation here

Create a Merge Join
Merge two data blocks together into a single data block in the Data Worksheet that contains all columns. No join relationship is applied. (Each row in the resulting data block appears in the same row position as in the originating data block.) Accompanying documentation here
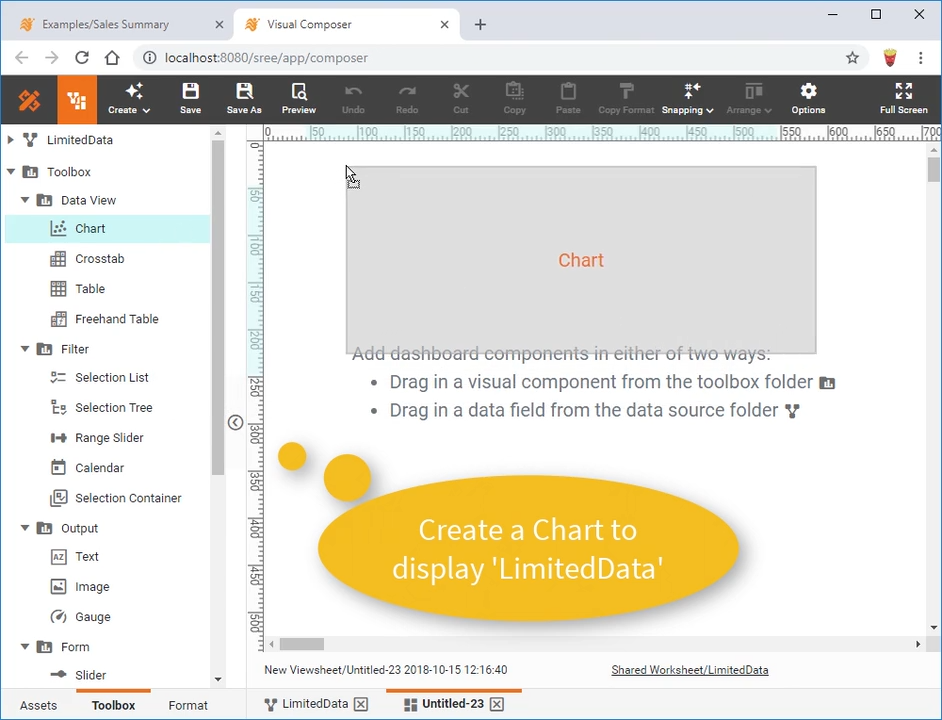
Update Embedded Data from Dashboard
Modify data in an embedded table (in a Data Worksheet) by using Form components on a dashboard. This allows you to use a dashboard for testing "what if" scenarios. Accompanying documentation here
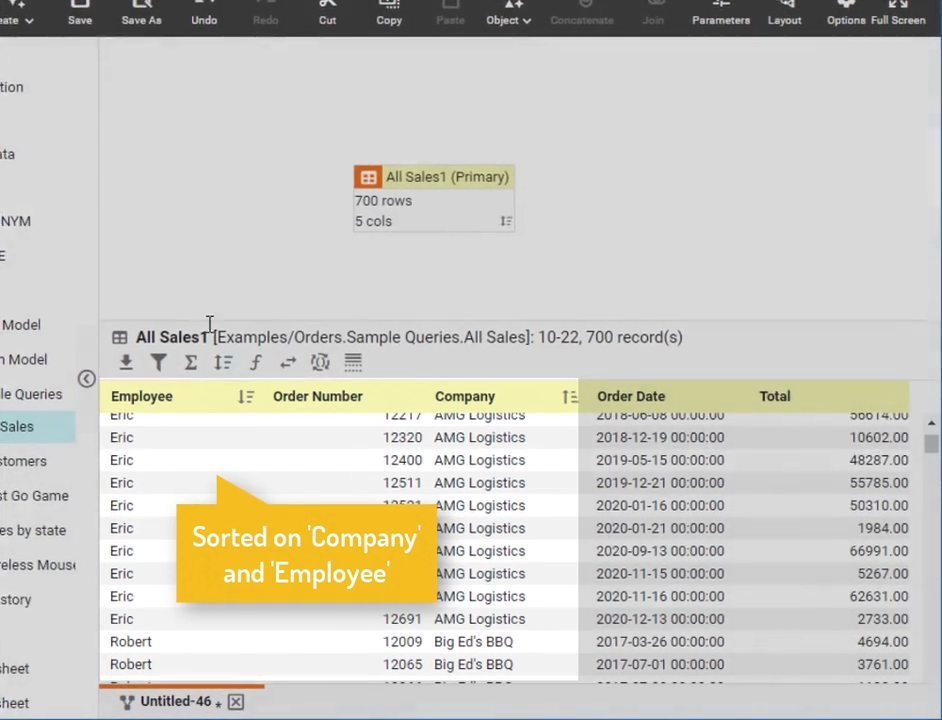
Sort on Multiple Columns
Sort a data block (in a Data Worksheet) on multiple columns simultaneously. Accompanying documentation here
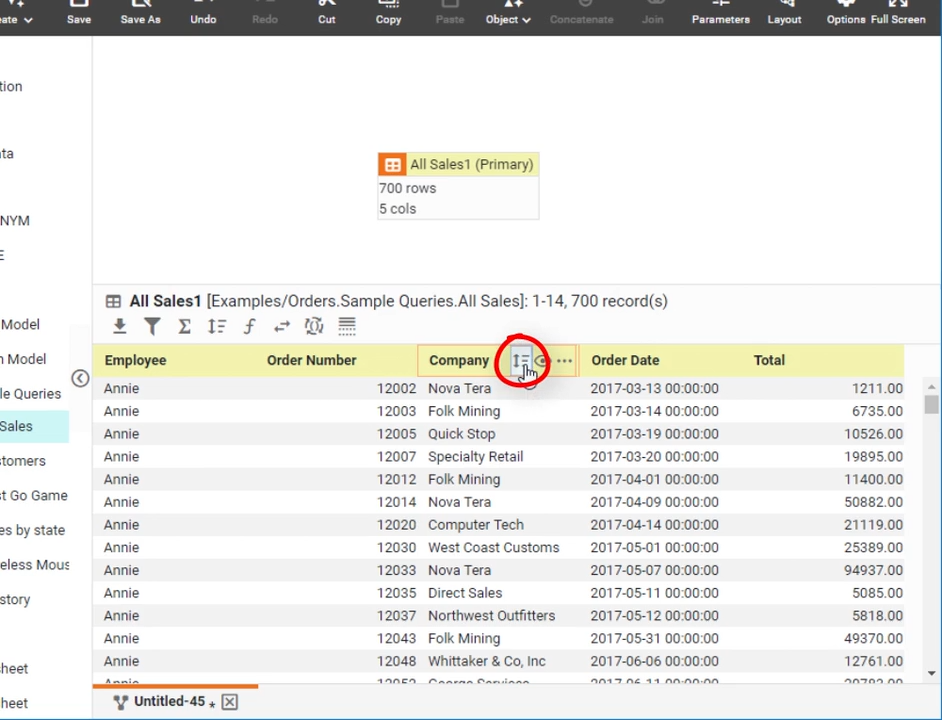
Sort Data on a Single Column
Sort a data block in a Data Worksheet using the values in a single column. Accompanying documentation here
Visualization Training
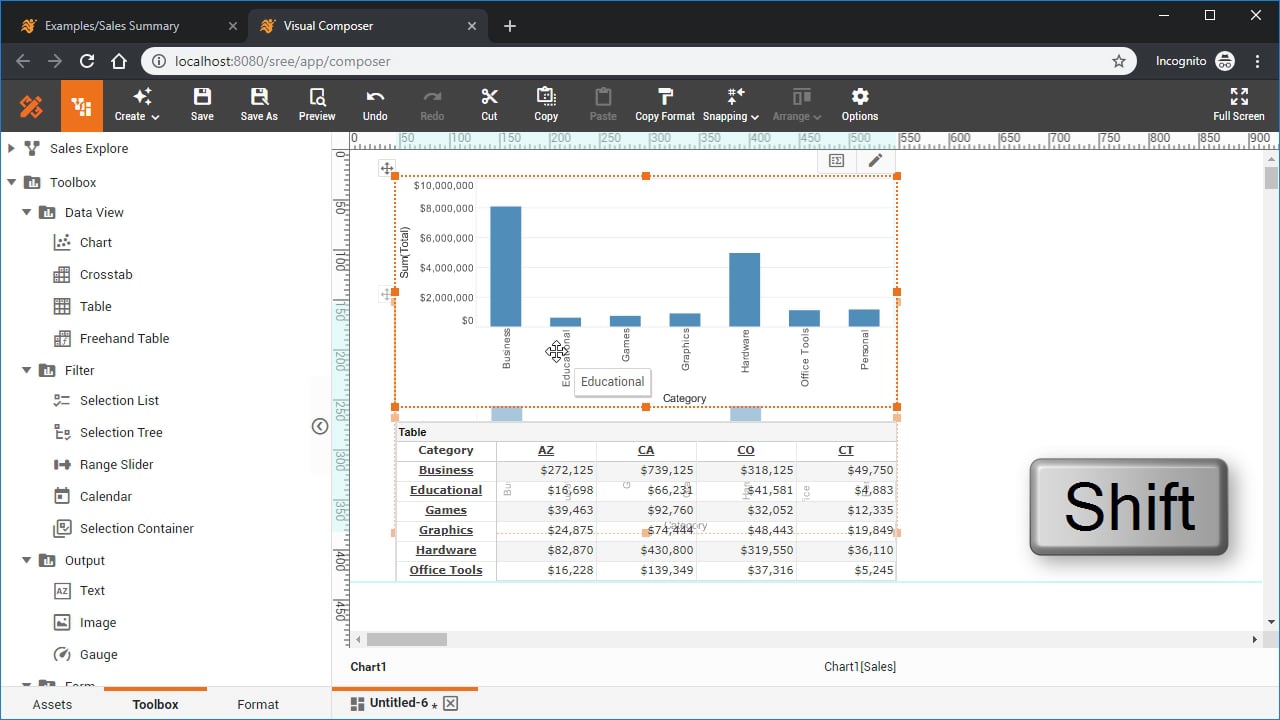
Create a Dashboard
Learn how to use InetSoft's Visual Composer to add a chart, table, crosstab, KPI, filters, or title, format data, and layout the dashboard for different devices. Accompanying documentation here
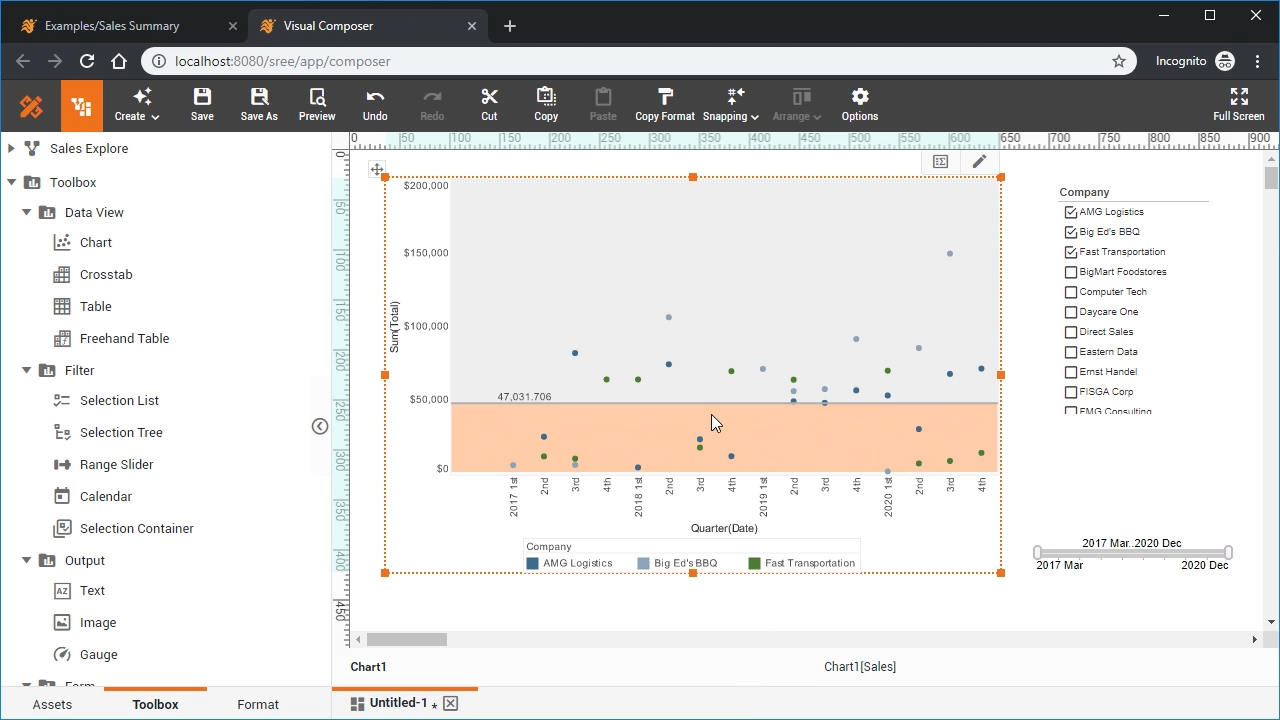
Create a Chart
Learn how to use InetSoft's Visual Composer to add a variety of chart types to your dashboard. Chart types covered include pie charts, point charts, bubble charts, and scatter charts. This video also covers how to add trend lines and target lines to your charts. Accompanying documentation here
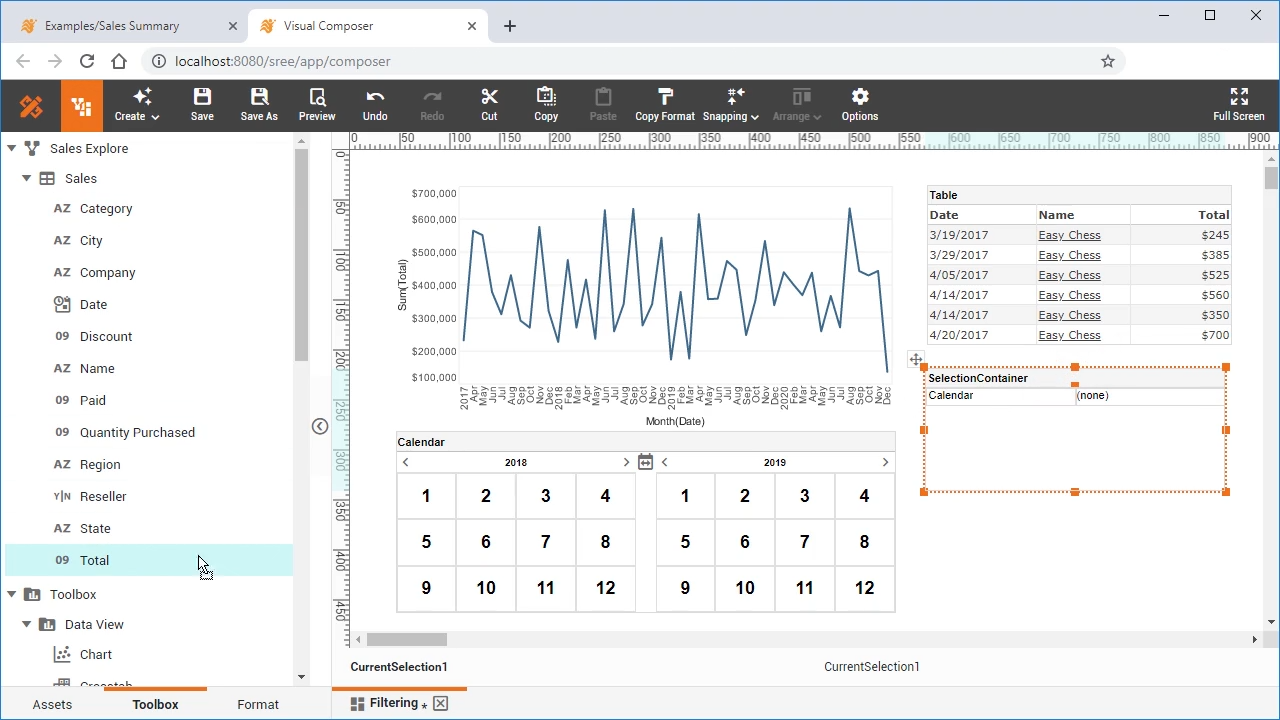
Filtering a Dashboard
Learn how to add a variety of filters to your dashboard, to enable drilldown and targeted data exploration. This video covers filtering on numerical, date and categorical data, filtering post-aggregate data, and also filtering data as an end-user. More advanced filtering topics covered include fixing filtering conditions, as well implementing dynamic filter conditions and flyover filtering. Accompanying documentation here
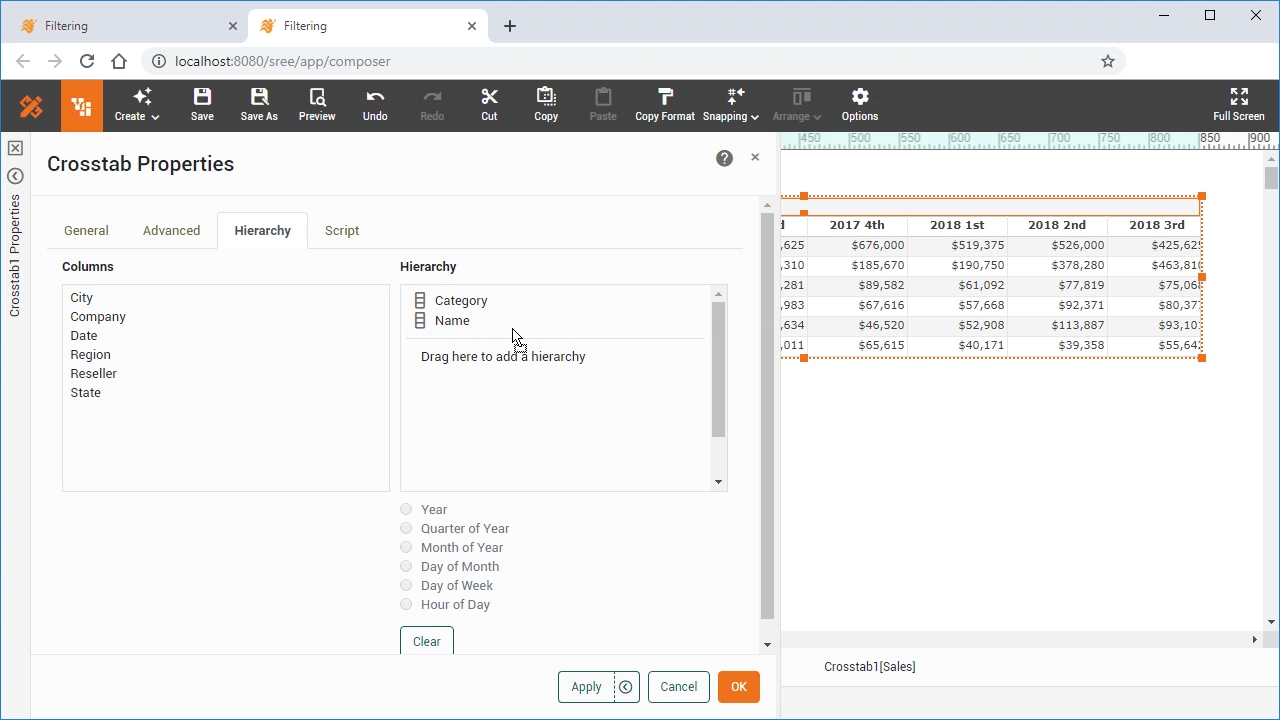
Grouping Data in a Dashboard
Learn about the different ways to group your data, whether it be in a crosstab or chart. Topics also include combining grouped data, and making data grouping dynamic. Accompanying documentation here
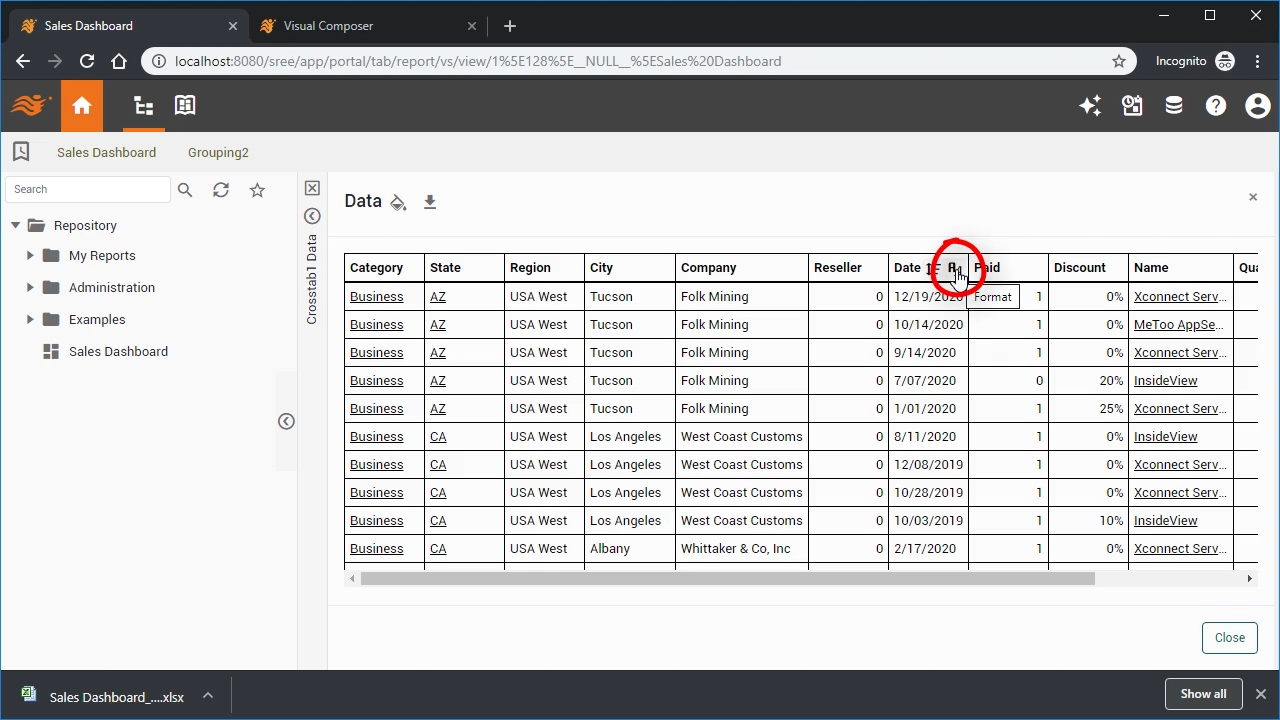
Exporting Data from a Dashboard
Exporting summary and detail data, from tables and charts. Accompanying documentation here
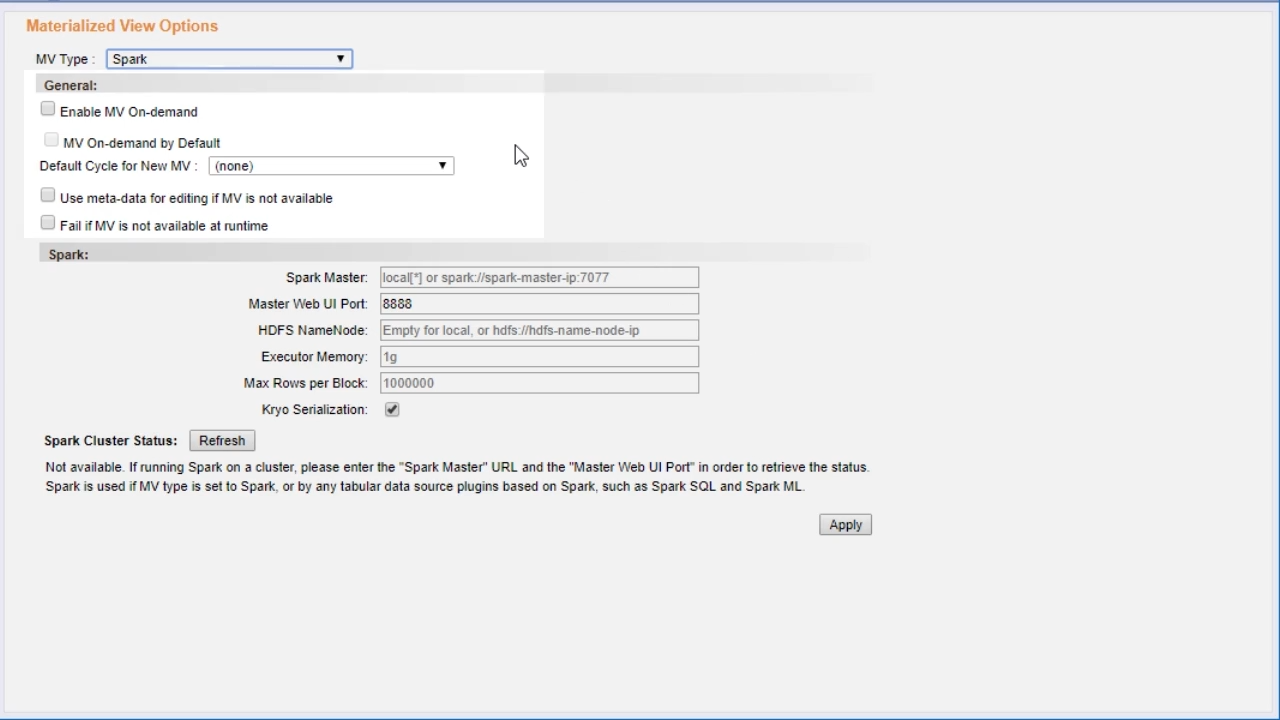
Create a High-Performance Cache
This video explains how to create and manage a materialized view for a dashboard, which is a high-performance caching mechanism to improve dashboard responsiveness and reduce demands on the database. Accompanying documentation here
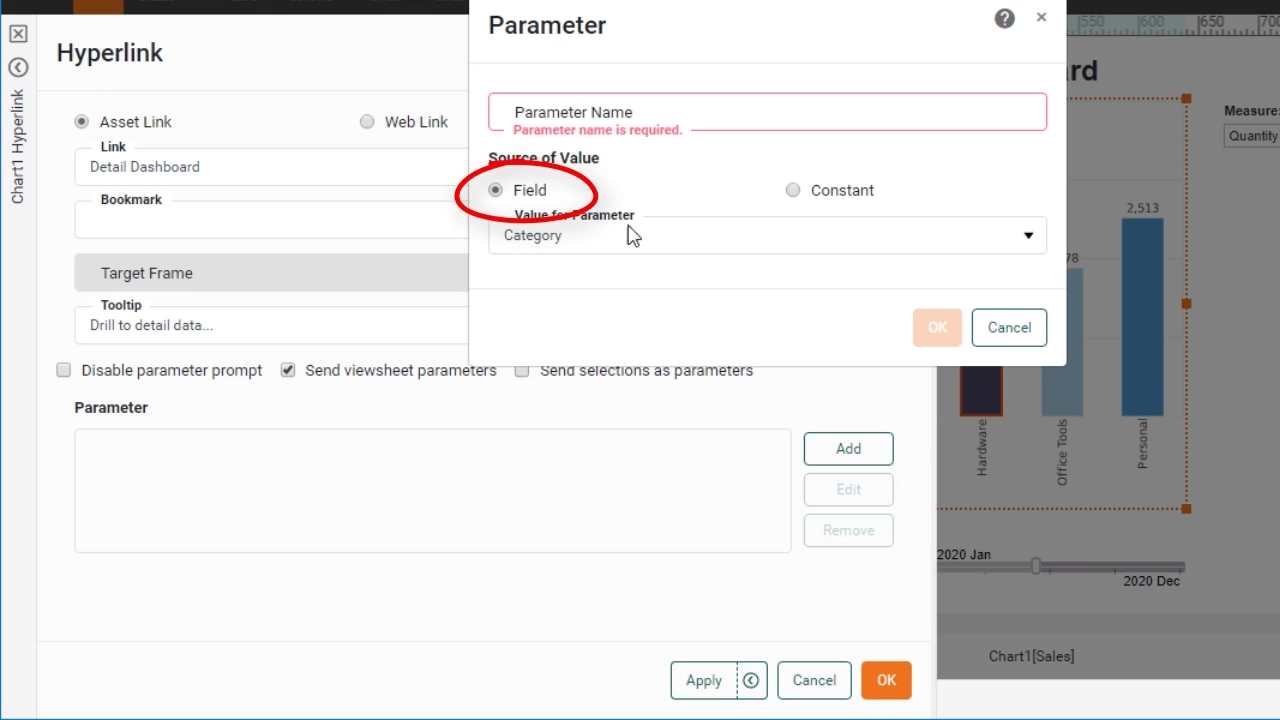
Add Drill-Down Hyperlinks
This video explains how to add drill-down hyperlinks to a dashboard, and how to pass context information such as parameters and filters from a summary-level dashboard to a detail-level dashboard. Accompanying documentation here
