What is Ad Hoc Reporting?
In a strict sense, an ad hoc report is a report that is created on the fly, displaying information in a table or a chart that is the result of a question that has not already been codified in a production report. There is a limit to the number of such production reports and business questions that can be anticipated and coded in advance so that users can consult them whenever they want. In a broad sense, ad hoc reporting is just a way to answer unanticipated questions.
As businesses are always changing, the questions people want to ask of their data are always changing, so any reporting system needs to accommodate the creation and running of ad hoc reports. Making that an easy process for the average business user is key because most ad hoc report tools are designed for database experts to use, often requiring knowledge of query language, such as SQL.
Not all the needs of ad hoc reporting are the same. Sometimes, business users are looking for a new report that can be repeatedly used in the future. Other times, the need is simply a one-off query to extract a data set.
The InetSoft Ad Hoc Tools
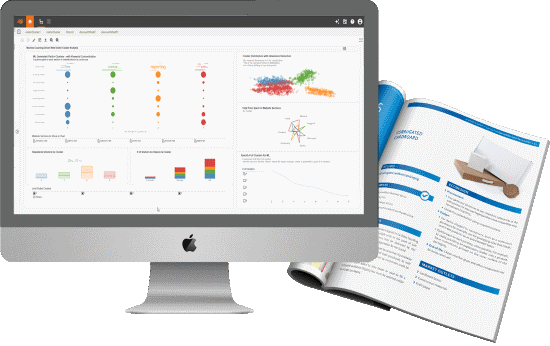
InetSoft offers two tools for ad hoc reporting: an ad hoc wizard and visualization dashboards. The ad-hoc wizard is designed for everyday business users with no technical background. Visualization dashboards are normally designed by analysts with built-in ad hoc customization. For power users, the drag-and-drop design user interface allows data mashup and ad hoc reporting from scratch.
Ad Hoc Wizard
The step-by-step ad-hoc wizard guides any business users to create an ad hoc report. Custom wizards can be added by technologists to suit particular business processes and user environments. This tool is particularly useful to produce detail oriented reports because of its paginated output format.
Flexible Ad Hoc Dashboards
The built-in interactive customization of InetSoft's visualization dashboards offers the first level of ad hoc reporting. Furthermore, analysts and power users can easily create new dashboards through a drag-and-drop web app. These users can be further empowered with data mashup ability to dynamically introduce new data for ad hoc reporting.
About InetSoft
Since 1996 InetSoft has been delivering easy, agile, and robust business intelligence software that makes it possible for organizations and solution providers of all sizes to deploy or embed full-featured business intelligence solutions. Application highlights include visually-compelling and interactive dashboards that ensure greater end-user adoption plus pixel-perfect report generation, scheduling, and bursting. InetSoft's patent pending Data Block™ technology enables productive reuse of queries and a unique capability for end-user defined data mashup.
This capability combined with efficient information access enabled by InetSoft's visual analysis technologies allows maximum self-service that benefits the average business user, the IT administrator, and the developer. InetSoft was rated #1 in Butler Analytics 2015 Business Analytics Yearbook, and InetSoft's BI solutions have been deployed at over 5,000 organizations worldwide, including 25% of Fortune 500 companies, spanning all types of industries.


