Best Performance Dashboards of 2026
The Importance of Performance Dashboards
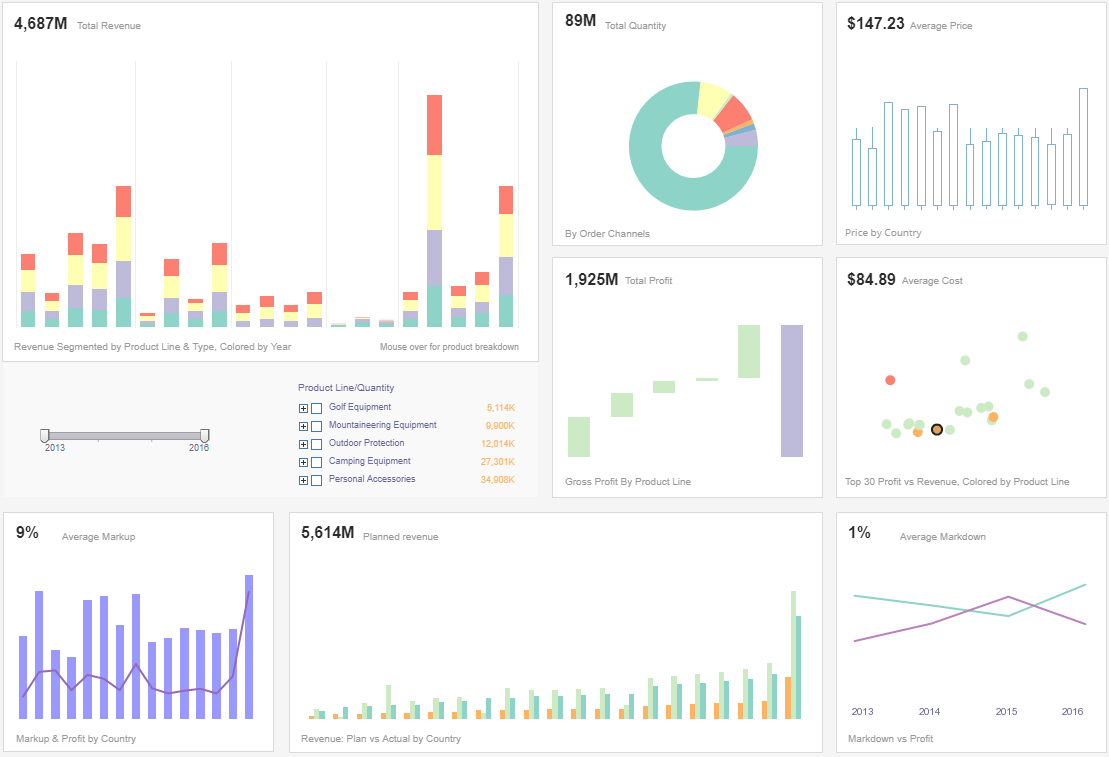
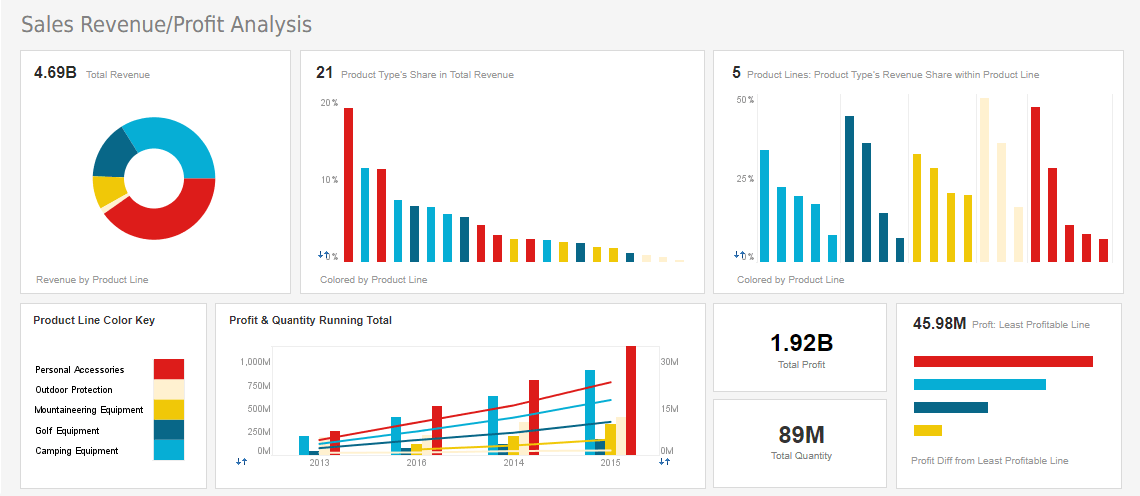
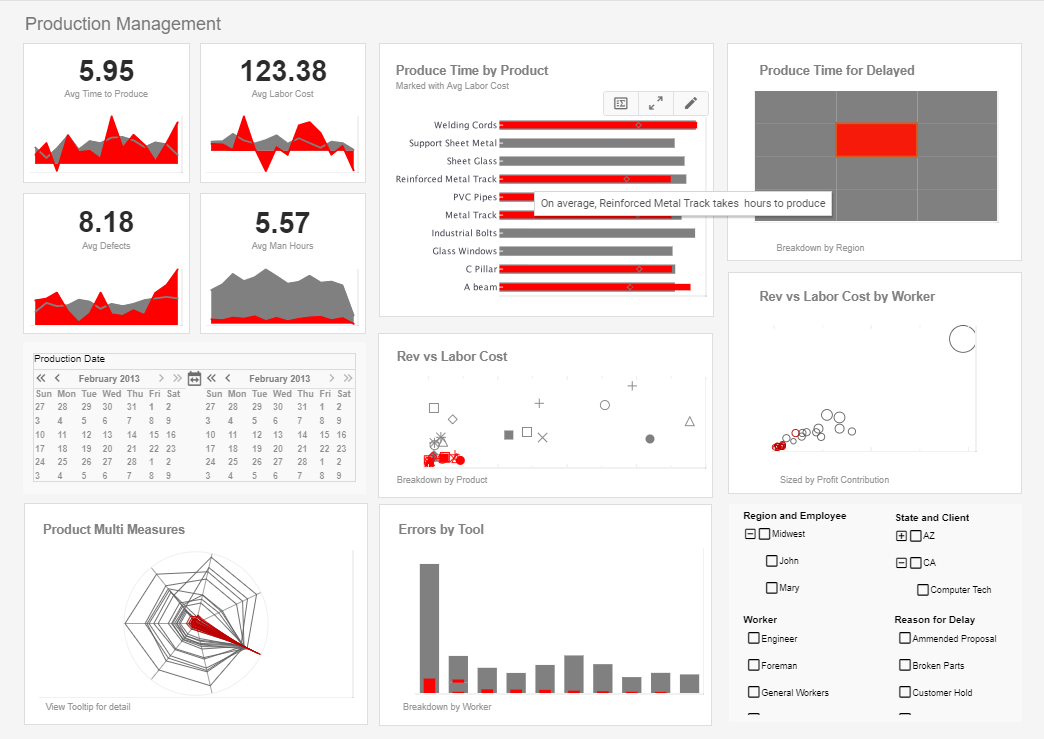
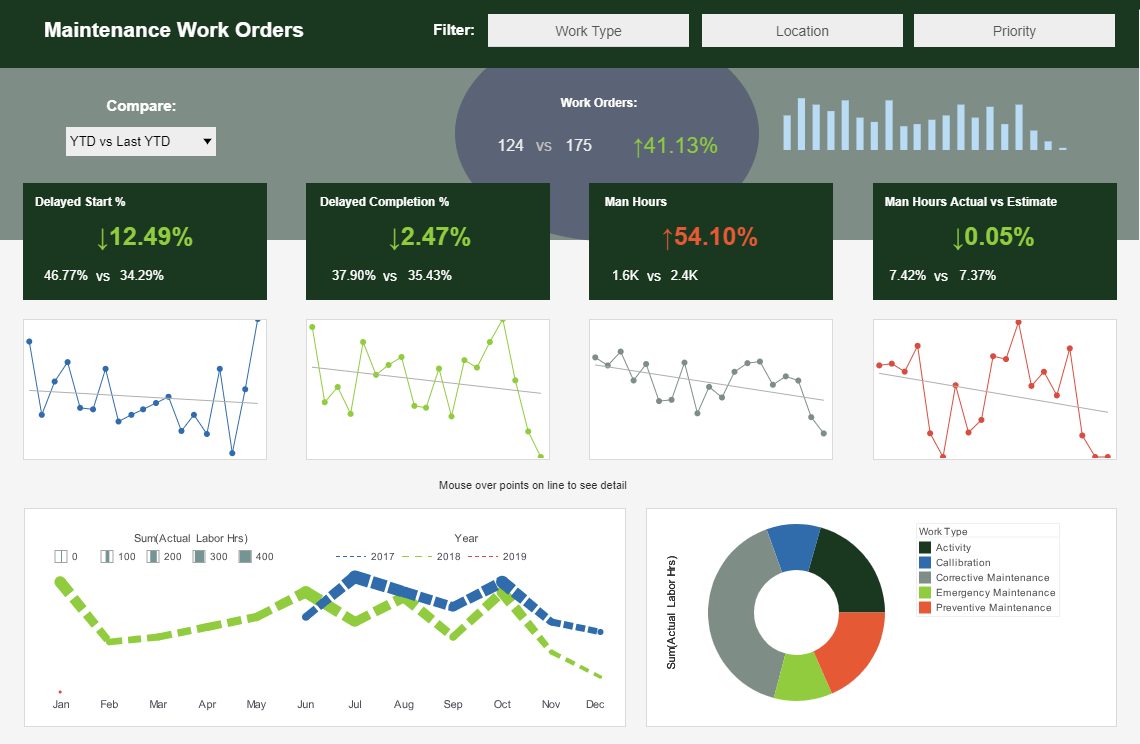
A performance dashboard is to a business what a windshield is to a driver: How would we know where we are, where we are going, and how to get there without one? At InetSoft, we understand that a good performance dashboard is the GPS for a healthy enterprise.
Performance dashboards allow businesses to view key metrics. They give decision makers the power to efficiently view and execute strategies, processes, and objectives while also serving as a measurement for business activities.
Dashboards also grant the ability to manage people and quickly communicate information to them. They are especially helpful when problems arise as they deliver alerts and analyses, and allow personnel to tackle issues in real time. Ultimately, business performance is optimized using performance dashboards.
Best Performance Dashboard from InetSoft
InetSoft dashboards allow static numbers and data to become interactive knowledge. This allows all personnel in the enterprise to make informed and superlative decisions for their business or department. InetSoft uses visualization-driven software atop a self-service environment, which allows all users to customize their search and view the information the way they like. This is possible through InetSoft's innovative StyleBI software.
StyleBI:
- Drag and drop is simple and easy – less help from IT
- No SQL skills are required
- Agile and secure infrastructure
- One stop shop: Includes dashboards, reporting, analytics, and access to practically any data source
Performance Management
Monitoring Dashboards: Aggregated information views using intuitive display objects give managers the current status with the ability to drill down and investigate.
Analytic Dashboards: Explore data to gain new insights through multi-dimensional visual charting. Simple point-and-click manipulation enables discovery of hidden patterns and relationships.
Mobile BI: Mobile devices such as phones and tablets, including those on Apple iOS, can access interactive dashboards and reports.
Performance Management Dashboard
Patent pending Data Block® technology allows all users to gather and mashup data in the format they would like in an easy, lego-like fashion and create their own interactive dashboard.
InetSoft has innovated unique capabilities for enterprise mashups. You do not have to be a BI analyst to create your own mashups. You can combine disparate tables and fields that were not previously mapped in a data model. Beyond that, you can also bring in your own data sets such as those in personal spreadsheets or those generated by vendors or partners.
Additionally, InetSoft's dashboards are web-based for speedy and reliable access. Load balancing and failover are provided through built-in clustering or J2EE server clustering. StyleBI also has access to multiple data sources, live page streaming so that users may view reports as they are being created, visual maps, and brushing so that you may select a point on a chart to highlight a related point on another chart.
Dashboard Support
With InetSoft's updates and modifications to StyleBI there is the guarantee of continuous support that helps make this a low-risk, high-return solution. Nonetheless, remember InetSoft's sophisticated performance dashboard is always:
- Easy
- Agile
- Robust
Dashboard Reviews
“The Computing and Decision Sciences department consistently tries to incorporate real-world experience and tools into the school’s curriculum. After seeing the power and flexibility of InetSoft’s data visualization software, the department thought this would be the perfect vehicle to provide students in a variety of courses exposure to this class of software.” - Dr. David Rosenthal, Chair of the Department of Computing and Decision Sciences, Stillman School of Business at Seton Hall University
“We had previously selected another BI solution, however delays in the installation process coupled with insufficient documentation curtailed our confidence in its efficiency. We decided to give InetSoft another look, and were pleased when were able to deploy the solution within one afternoon. Another deciding factor in our decision to go with Style Intelligence was ease of installation and setup. ” - Eric Jamieson, Director of Business Intelligence at Underground Elephant
What Makes InetSoft's Open Source StyleBI a Good Choice for Creating Performance Dashboards
InetSoft's open-source StyleBI is a strong choice for creating performance dashboards due to its flexibility, ease of use, and powerful data visualization capabilities. It combines a data transformation pipeline with a visualization engine, allowing users to rapidly build analytics and reporting tools.
Key advantages include:
-
Deployment Flexibility: StyleBI is built as a Docker container, making it easy to deploy on compact platforms or cloud environments.
-
Interactive Dashboards: Users can create desktop and mobile-friendly dashboards or schedule static reports with automatic pagination.
-
Self-Service Features: It enables team collaboration with built-in security and self-service options, empowering users to create and share insights.
-
Web-Based Access: Since it runs as a web app, users can access dashboards from any permitted device without needing local installations.
-
Multidimensional Analysis: StyleBI supports interactive charts with filtering options like sliders and selection lists, making it easy to manipulate metrics in real time.
Let's compare InetSoft's StyleBI with other open-source dashboard tools like Grafana and Metabase based on key factors such as data connectivity, visualization capabilities, and scalability.
Comparison Overview
| Feature | InetSoft StyleBI | Grafana | Metabase |
|---|---|---|---|
| Deployment | Docker-based, lightweight | Requires Grafana server | Easy setup, runs on JVM |
| Data Connectivity | Supports diverse sources, including REST APIs | Primarily time-series databases | SQL-based, best for structured data |
| Visualization | Interactive charts, dynamic filtering | Strong time-series visualizations | Simple but customizable dashboards |
| Access Control | Built-in role-based access | Advanced permissions for multiple users | Basic user management |
| Custom Reports | Scheduled reporting with pagination | Limited custom exports | PDF & CSV exports supported |
| Best Use Case | Business intelligence & analytics | System monitoring & DevOps | Quick insights from structured data |
Key Takeaways
-
StyleBI stands out for business intelligence applications, offering multidimensional analysis and powerful reporting tools.
-
Grafana excels in real-time system monitoring, making it ideal for DevOps and infrastructure management.
-
Metabase is great for exploratory analysis, providing simple yet effective dashboards for structured data queries.


