Searching For BI Dashboard Examples?
Below are examples of BI dashboards. A BI dashboard is a business management tool that will allow a business to keep track of all aspects of their daily activity. These intuitive and interactive dashboards allow companies to manipulate their data in such a way as to make it easier for employees and management to understand.
BI Dashboards, or business intelligence dashboards, allow businesses and users alike to present and organize their data in standardized tables and chart. This allows companies to present this data, no matter how complicated, in an easy to use dashboard. The business intelligent dashboards help eliminate the confusion of dealing with numbers, and help to focus the discussion toward strategic management. These solutions are critical to running an efficient and most importantly, a profitable business.
Executive Sales Overview Dashboard
Risk Management Consultancy Dashboard
Win/Loss Opportunity Outcome Analysis

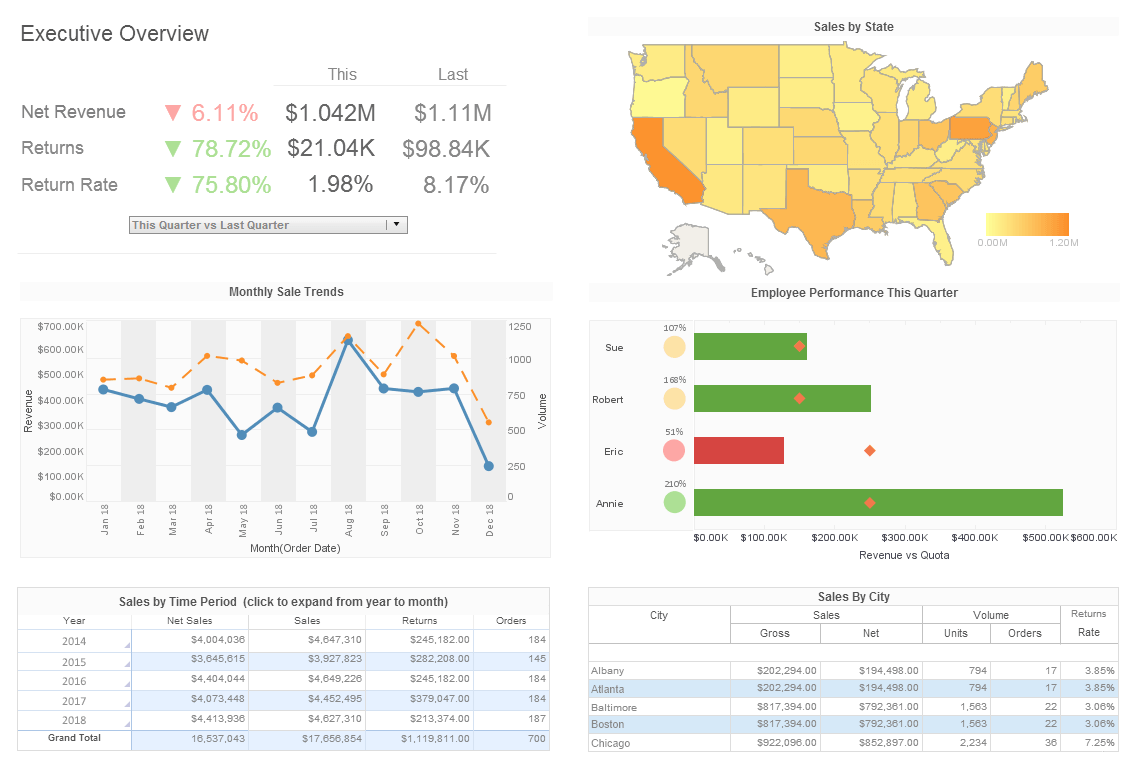
This executive sales overview gives executives an overview of sales by area, time period, and salesperson. The Employee Performance by Quarter chart displays employee sales relative to their quota, with bars turning red when performance lags behind the goal. Salespeople might lag behind goals due to insufficient lead generation, which limits their opportunities to close deals. Additionally, ineffective sales strategies or lack of product knowledge can hinder their ability to convert prospects into customers.

This risk management consultancy dashboard displays various measures of risk and compliance. An incidents by date chart features a red line tracking actual losses, utilizing color to draw the users attention to what's most important. In risk management, Value at Risk (VaR) is a widely used metric that estimates the potential loss in value of a portfolio over a defined period for a given confidence interval. Expected Shortfall (ES), also known as Conditional VaR, measures the average loss that could occur in the worst-case scenarios beyond the VaR threshold, providing a more comprehensive view of tail risk. Key Risk Indicators (KRIs) are used to monitor and quantify early warning signs of potential risks, enabling proactive mitigation before issues escalate.

This win/loss opportunity outcome analyses wins and losses by category, opportunity source, and proposal type. With wins in green, losses in red, and declines in yellow, this dashboard is a great example of how our intuitive associations with different colors can be used to make a dashboard more communicative. Attorneys often use billable hours as a key metric to track the time spent on client work, which directly impacts revenue and productivity. Case success rate, measured by the percentage of favorable outcomes in litigation or settlements, is another critical metric to evaluate an attorney's effectiveness and reputation.
Bank Demographics Report
Sales Performance Report
Help Center Management Portal

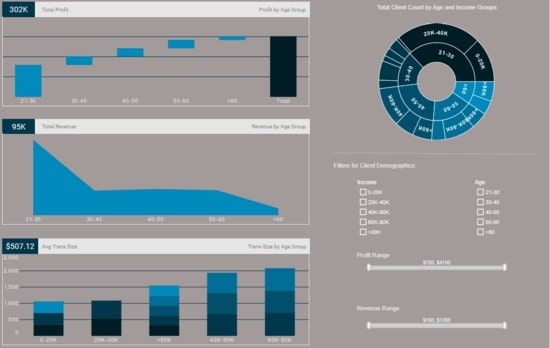
This interactive bank demographic report can help bank managers identify their most valuable customer demographics. The sunburst chart on the top right is an effective way to show how different customer segments relate to each other. Know Your Customer (KYC) is a process that businesses use to verify the identity of their clients, ensuring compliance with regulatory requirements and preventing fraud. It typically involves collecting personal information, such as identification documents and financial details, to assess risks and establish trust.

This sales-by-state sales performance report gives a broad visual breakdown of revenue, prices, and profits, by product line. Color is used in several of the charts to add another dimension. The live version features a mouseover chart, packing in even more information without wasting dashboard real estate. A salesperson's effectiveness can be increased by providing targeted training to sharpen their communication, negotiation, and product knowledge skills. Additionally, equipping them with customer relationship management (CRM) tools can streamline their workflows and help them better understand customer needs, leading to stronger results.

This real-time help center management portal gives shows call center managers how many calls their employees are handling and how long they are taking. The dashboard refreshes ever 30 seconds, with individual employees represented with icons that change color when the employee is on the phone. A call center's effectiveness can be enhanced by implementing advanced analytics tools to monitor performance metrics and identify areas for improvement, such as call resolution time and customer satisfaction. Providing ongoing training for agents, focused on communication skills and product knowledge, can further improve the quality of customer interactions and outcomes.
Maintenance Efficiency Analytics
Multidimensional Demographic Analysis
Predictive Music Industry Dashboard

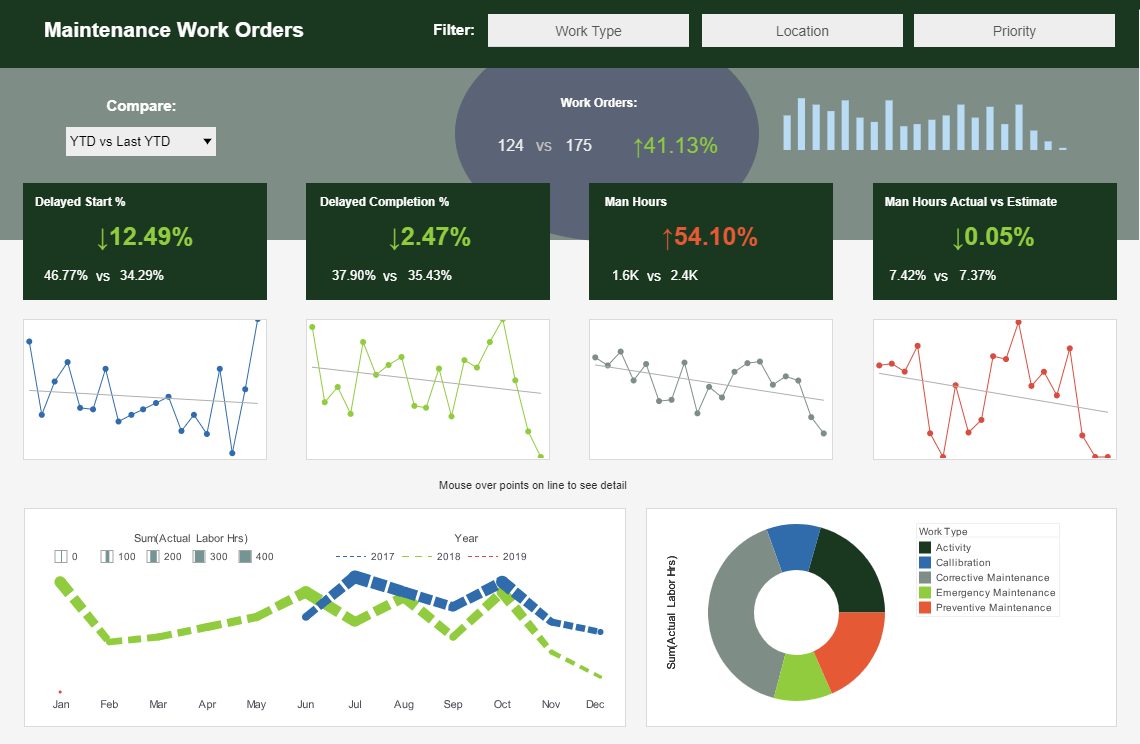
This maintenance efficiency analytics sample displays the percentage of work orders started and completed, and tracks the man hours necessary for completion of said work orders. A number of line charts display the fluctuations in these various measures over time, enabling managers to pinpoint where specific issues occurred. A maintenance department's effectiveness can be boosted by implementing a preventive maintenance schedule, minimizing unexpected equipment failures and downtime. Leveraging digital tools such as computerized maintenance management systems (CMMS) can further optimize task management, tracking, and resource allocation.
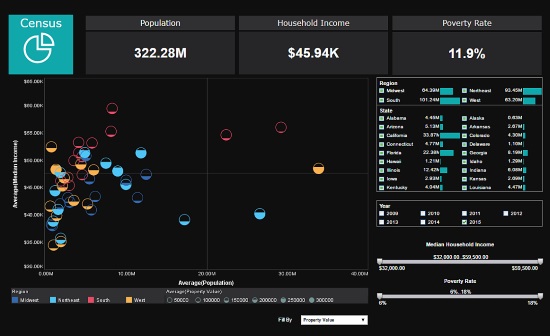
This multidimensional data analysis of US census data uses multidimensional charting to display population, income, region, and property value, all in a single chart. Various filter elements enable possible patterns in the data to be discovered and explored. The U.S. population has been growing at its fastest pace in over two decades, with a 1% increase from 2023 to 2024, reaching 340.1 million. By 2030, demographic shifts are expected to make immigration the primary driver of population growth, as the aging population expands and older adults outnumber children for the first time in U.S. history.

This predictive music industry dashboard example by InetSoft can be easily embedded into applications to help creators find the next hot music genre in certain areas. In the example dashboard, the most important audio features impacting popularity are identified by regression model. Moreover, end user can deep dive into the music fusion by checking simulated decision tree of genre classification. AI predicts new music for listeners by analyzing their past listening habits, preferences, and genres through machine learning algorithms. It also integrates collaborative filtering and content-based recommendations to match individual tastes while introducing songs with similar patterns or features.
