Corporate Dashboard Examples
Most people would never drive a car without a dashboard because it’s dangerous and there is no way of knowing that you will make it to your destination. The same applies for running your business. Corporate dashboards help you monitor your company and navigate the uncertain business terrain.
Successful business leaders understand that in order to continue growing, setting objectives and measuring performance is essential. As an innovator in reporting software since 1996, InetSoft has pioneered the evolution from static reporting towards interactive visualization of data via dashboards.
This page contains screenshots of corporate dashboard examples built with InetSoft's drag and drop dashboard software. Click on the screenshots to get a closer look.
Corporate CRM Dashboard

This dashboard enables a corporate sales manager to keep track of how the sales department is keeping up with current leads, and also helps pinpoint which leads need to be contacted again. Leads can be filtered by date modified, status, amount of touches, and by account name.
A calendar selector makes it very easy to compare leads by date. The dashboard also features a search bar, allowing the status of individual leads to be researched.
Corporate Call Center Dashboard

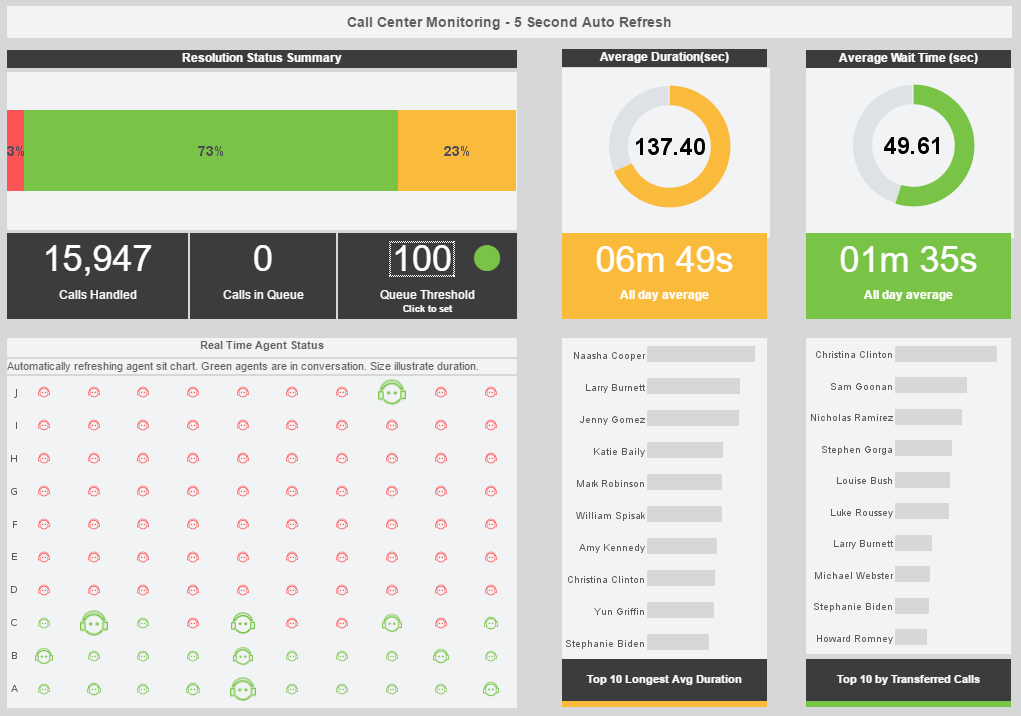
This live corporate call tracking visualization helps call center managers supervise their customer service reps. An agent status chart shows, in real time, who is on the phone and for how long. Large KPIs provide the daily call and wait time average, giving managers an at-a-glance picture of customer service quality.
Corporate Risk Dashboard

This corporate risk management visualization from InetSoft partner Protecht displays various measures of risk and compliance. An incidents by date chart features a red line tracking actual losses, utilizing color to draw the users attention to what's most important. A section of open actions lets the CEO viewing the dashboard know what further steps need to be taken.
Corporate Sales Team Dashboard

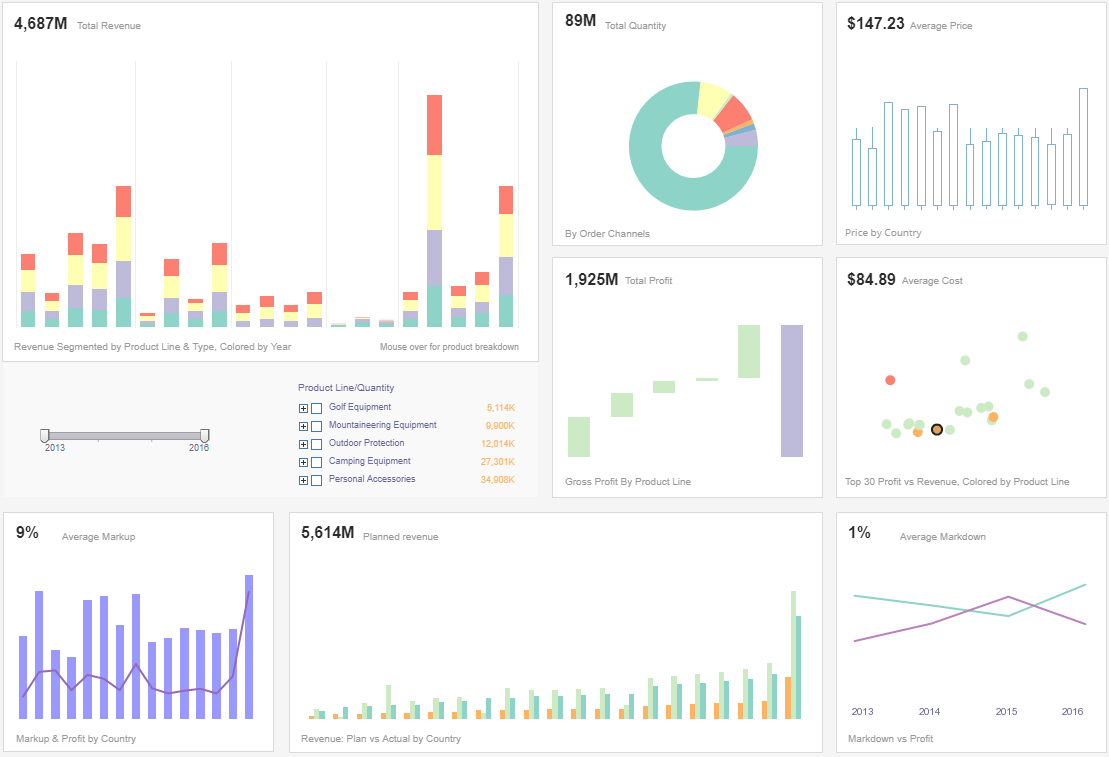
This corporate sales team dashboard gives a high level overview to executives monitoring inventory and sales performance. >Profit and price are also detailed, covering basic accounting needs as well as sales. Color is used in several of the charts to add another dimension. Chart types used throughout include a waterfall chart displaying profit by product line, and a candlestick chart showing average price.
Corporate Agribusiness Dashboard

This corporate agribusiness dashboard is designed to provide big agra execs with a comprehensive understanding of global agricultural production and crop yield in different nations. Our dashboard integrates a range of data, including crop types, national statistics, weather conditions, pesticide usage, yield data, and more, to empower you to make informed agricultural decisions. This InetSoft dashboard incorporates various visualization tools, such as tables, bar charts, line graphs, maps, and more, to assist you in gaining a better understanding of the data and its underlying insights. With the use of filters, it also helps you swiftly pinpoint your areas of interest, for example, countries, crop types, and years.
Corporate Global Profits Dashboard

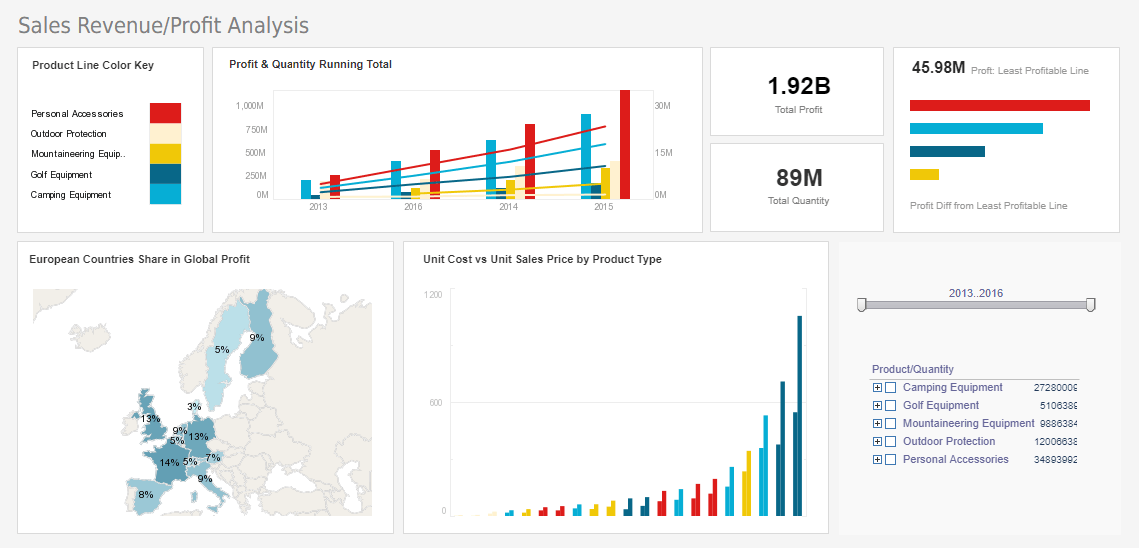
This corporate profits dashboard features a geographical map chart, displaying each country's share of global profit, colored once again using monochromatic scaling. Since countries are recognizable by shape, a map chart can omit country names, making the chart less cluttered.
While color shade gives an overall visual impression of how particular nations compare to the rest, the addition of text labels enables the viewer to compare nations with similar figures.
Corporate HR Dashboard

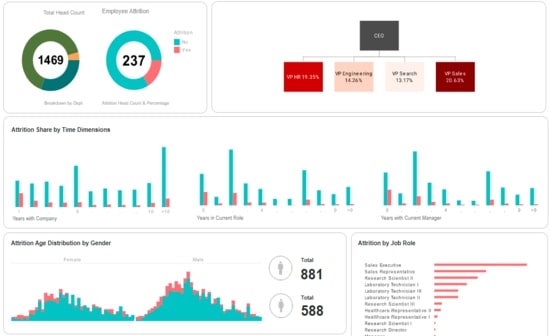
This corporatehuman resources dashboard helps corporate HR managers identify factors in employee attrition.
Attrition data is broken down by gender, department, marital status, and years worked. A treemap chart breaks down attrition among senior job roles.
Corporate Hotel Chain Dashboard

The corporate hotel chain dashboards embodies InetSoft's commitment to 'Intelligence With Style'. Beyond its sleek, user-friendly interface lies a powerful engine capable of processing multi-dimensional data, providing hotel managers with the foresight to anticipate hospitality market trends and guest needs. It's an essential tool for anyone in the hospitality industry looking to elevate their operational efficiency, enhance guest experiences, and drive profitability.
For businesses that generate numerous reports in multiple departments, gathering and analyzing all the data is critical for success. An effective corporate dashboard is an important tool that enables leaders to view the big picture of their company in an instant.
InetSoft's award winning corporate dashboards put Key Performance Indicators right at your fingertips. Click on the screenshot to the left to see InetSoft's solution up-close.
Want to try building an InetSoft dashboard yourself? Sign up for our free test drive, no download required.
| More: Web Dashboard Examples |