Dashboards offer companies various ways of representing their data. From sales projections, to employee statistics, and even inventory stock, database dashboards are able to easily represent all of the numerical data that your company can hold, into a visually appealing dashboard.
This international orders dashboard gives supply chain managers an overview of orders and returns.
A made to order vs actual time chart helps ensure that expectations are being adequately met.
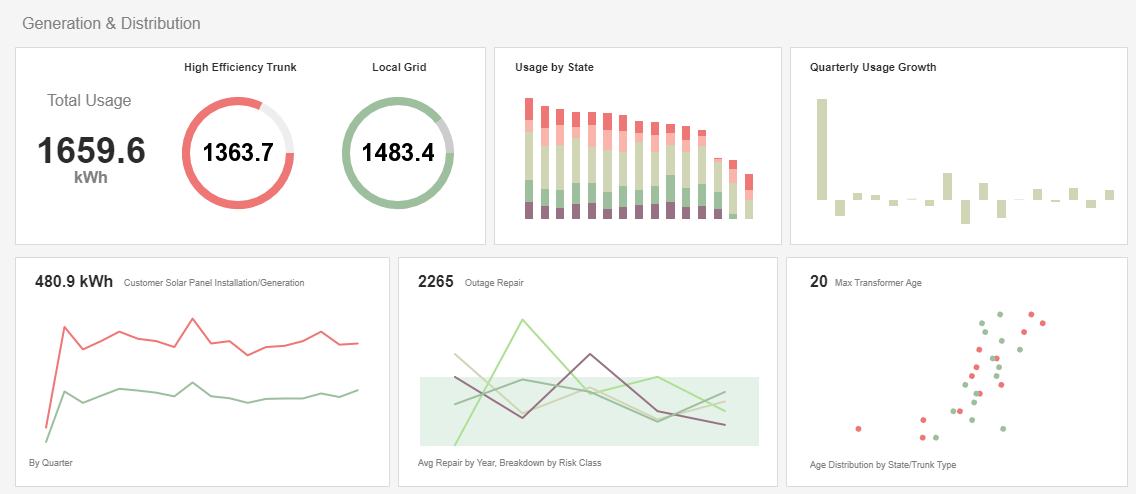
This alternative energy dashboard is helpful in managing all aspects of a power grid.
Usage is tracked by state and power source, with outages and transformers monitored as well.
Using performance data and metrics within a company, this labor time dashboard measures production efficiency, enabling shop managers to meet their deadlines with ease. The dashboard graphically represents the status of each phase of the manufacturing process, provides managers with great insight to act accordingly and make decisions in a confident manner.
This marketing lead pipeline dashboard gives marketing managers the metrics they need to monitor sales pipelines and optimize strategy. Lead count and source are tracked as well as conversion rates, with monthly change highlighted based on slider selection.
This live agent status dashboard helps call center managers supervise their customer service agents in real-time.
An agent status chart shows, in real time, who is on the phone and for how long
This dashboard of United States economic data uses fill and color to add two extra dimensions to it's main chart.
A drop down list with 5 different economic development measures to plot by fill adds another level of interactivity.
This meteorological map dashboard tracks the path of hurricanes over 25 years.
The dashboard uses maps with paths, a type of map that includes information about a specific path or route.
Having two identical map charts side by side, with independent interactivity, makes it easy to compare one year to another.
InetSoft's social media bot detection dashboard makes use of dynamic text, which is text that is hooked up to data sources and updates automatically as new data becomes available. By tracking possible bot accounts by the number of followers or posts, fraud management teams can gain insights into the potential impact of these accounts on their social media platforms.
This product defects dashboard enables quality control managers to monitor and analyze everything, from product defect rate and pipeline duration to shift performance and technician performance, all in one dynamic view. With built-in filtering components, manufacturing professionals can easily slice and dice product quality data with simple point-and-click methods to get various insights.
Dashboards come in various different styles and presentations, and choosing the correct one can greatly affect your business. All dashboards will be able to present your data in some well formatted visual display, but database dashboards can integrate specific data from your company database that you need to present to employees or clients.
Database dashboards are agile enough to allow for managers to implements any data metrics they need for their company, yet robust enough to handle all of the computing needs necessary. This combination has allowed database dashboards to be found in nearly every business that uses some sort of Business Intelligence Software.
Database dashboards combine the use of metrics and key performance indicators to produce a visually appealing chart or design. These lead to easy understanding and analysis of performance, quality assurance, and even crisis for a single department, or overall for whole companies.
Database dashboards can organize data into cubes that contain measures and dimensions, and are sometimes based on relational databases within a company. This allows access for a more in depth look into exactly which components are working and which are not.
With InetSoft's easy drag and drop dashboard design, you are able to fully customize reports geared toward your specific business. You have full control over with metrics and key performance indicators (KPI) that you wish to choose, and are able to combine and conform them to your growing business.
Copyright © 2024, InetSoft Technology Corp.