What Are the Three Pillars of Data Analytics?
It is said that a picture is worth a thousand words. If all the information we use everyday was presented in a visual format, we'd be observing pictures and graphs that compound multiple words, thoughts, and data.
Although implementing that idea to our everyday lives is in the distant future, businesses can enjoy this idea in the present with a database visualization software.
At InetSoft, we pride ourselves on business intelligence and providing organizations with the best solution. With our top of the line BI software, StyleBI, users will be able to access a slew of databases and convert the data into organized visuals.
Want to learn more? Contact us for more information and we'll provide free technical assistance with your evaluation.
Visualizing Informational Data With InetSoft
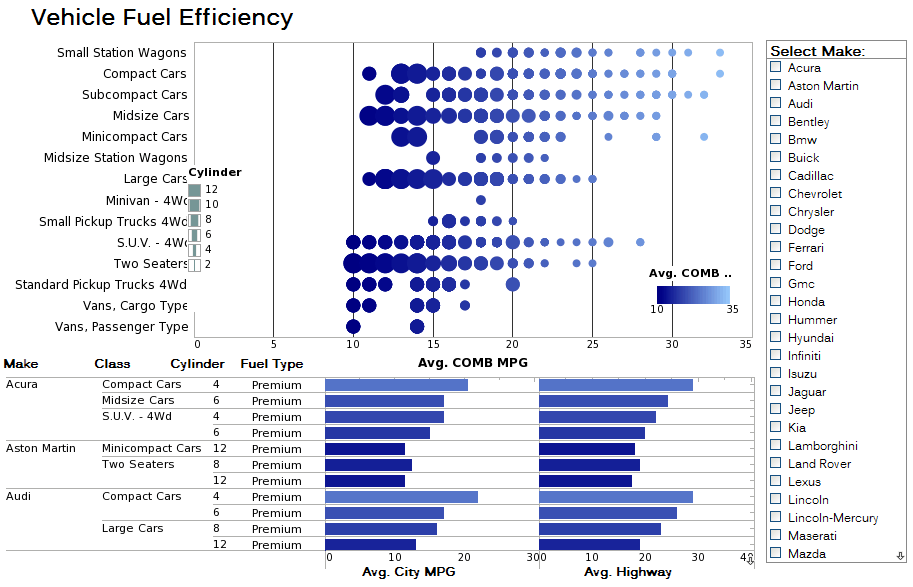
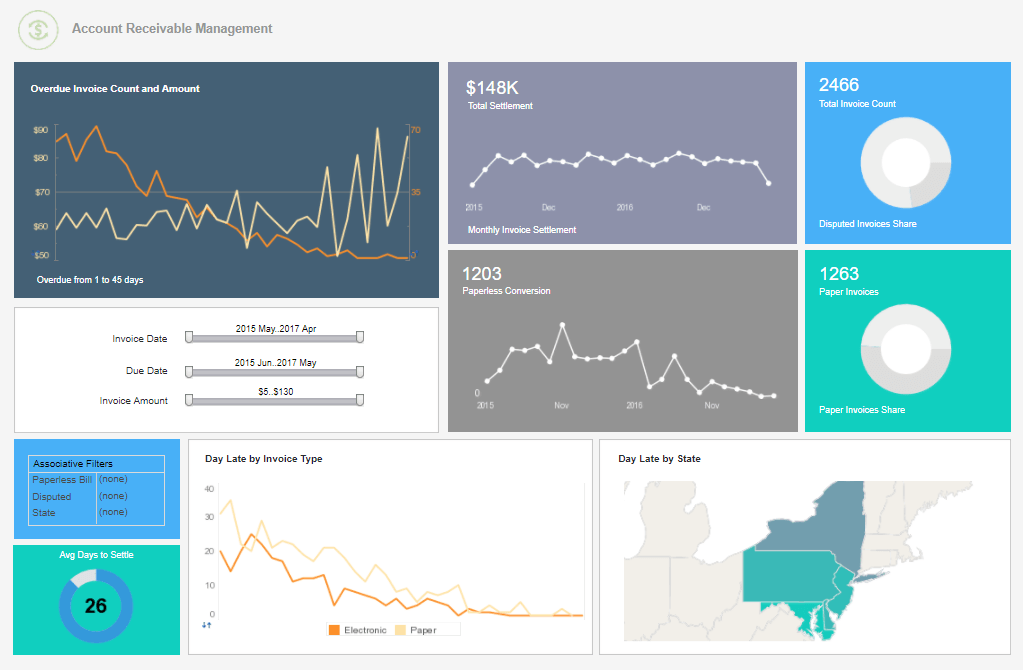
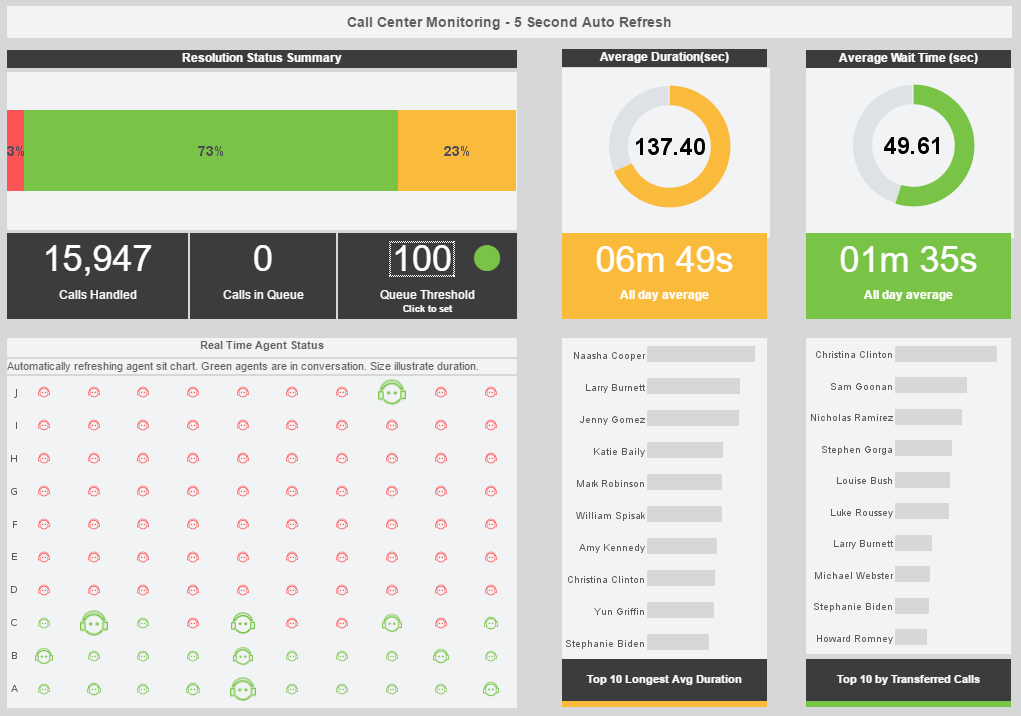
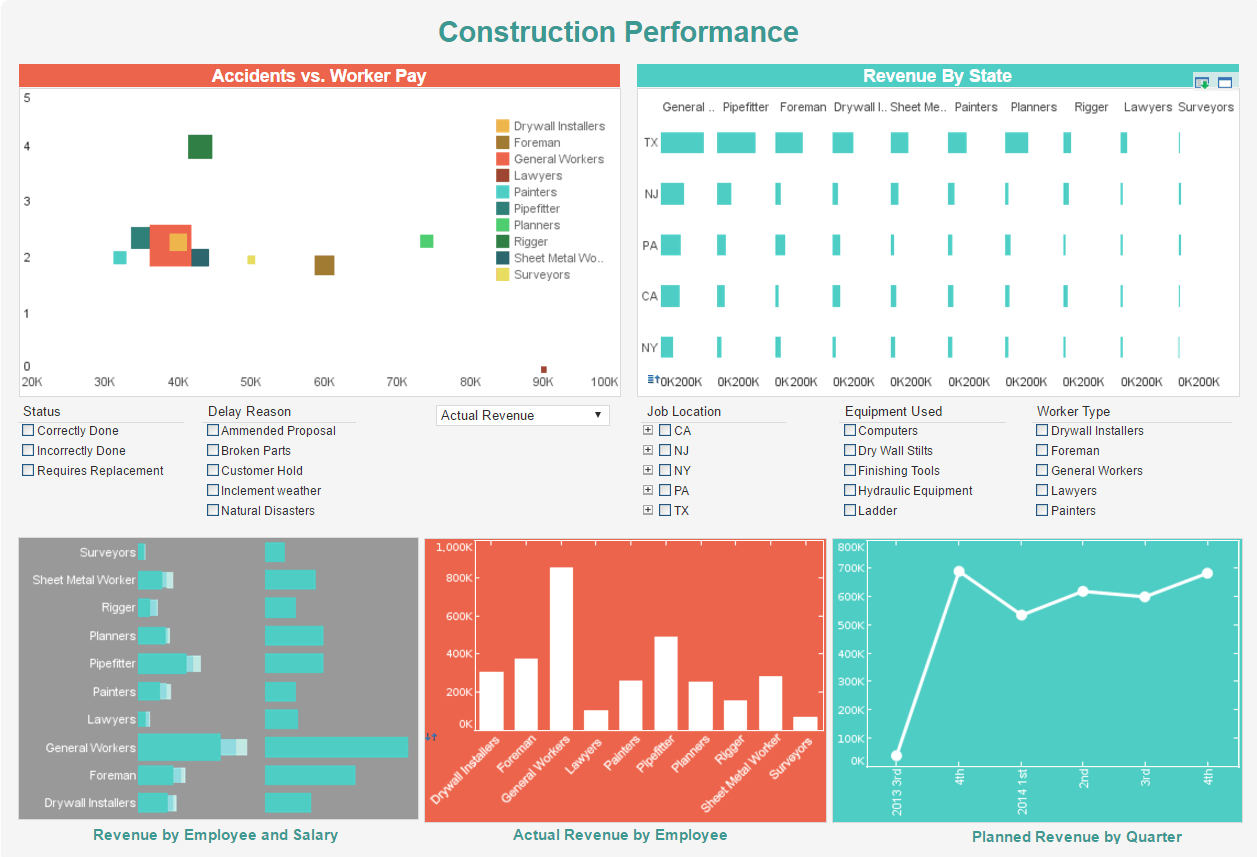
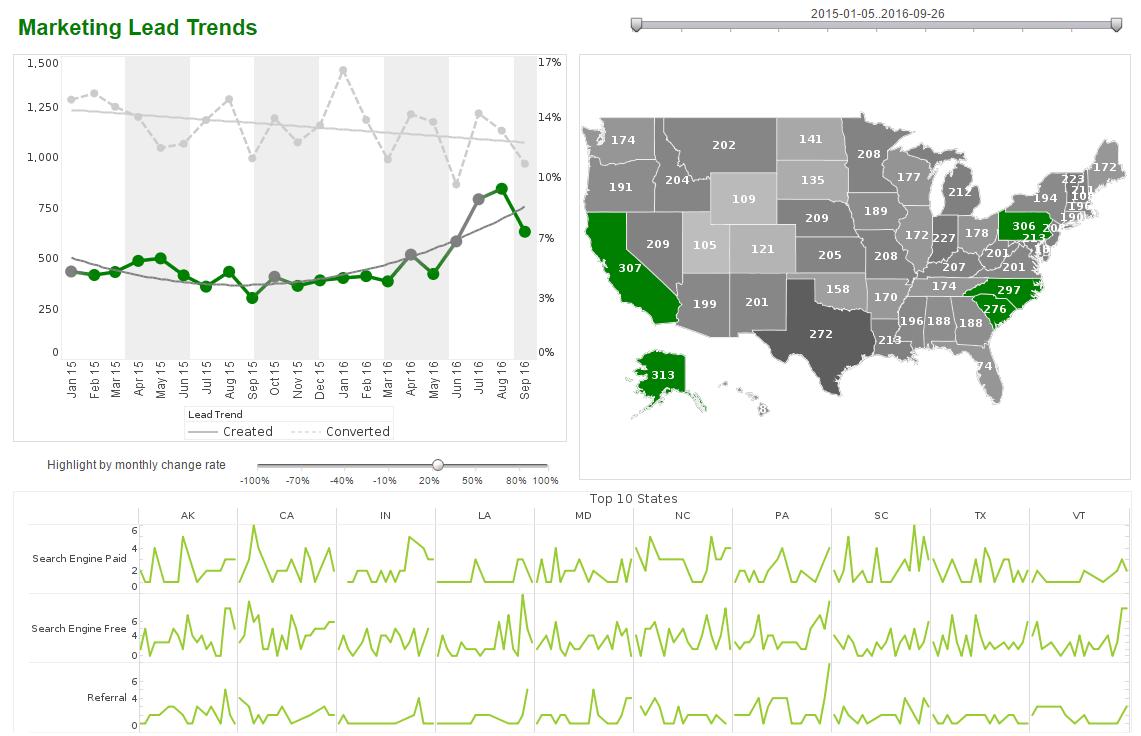
InetSoft's data visualization software allows users to gather and analyze data in a swift and coherent manner. User's unfamiliar with the backend IT development process of creating a visualization chart, dashboard, or report can take advantage of the Java-based software by applying a self-service method. This allows users to skip all the nitty-gritty details of the software and go directly into building a visual analyses and/or dashboards.
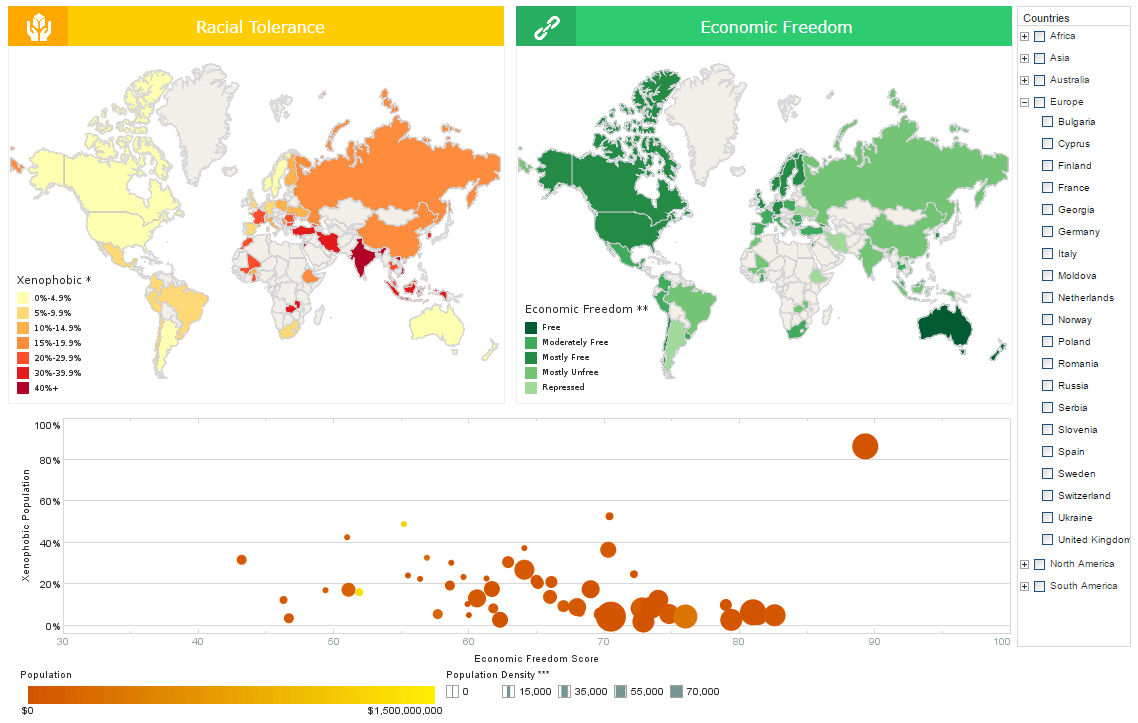
What makes our software so effective and easy-to-use are the highly praised customization capabilities. Users are free to manipulate the size, color, font, text, layout, or display of any element they choose and craft the visualizations that make the most sense to them with virtually unlimited design options.
Since InetSoft's software is a zero-client server-based solution, any visualization can then be shared throughout an organization to paint an accurate portrait of internal and external performance. Security features assign several levels of permissions to groups or individuals, decision makers to access and dissect the information they need, when they need it.
By accessing your enterprise data directly, users are always assured of visualizing the most up-to-date information available giving them the ability to compare and contrast real-time and historical data.
Visualization Features Include:
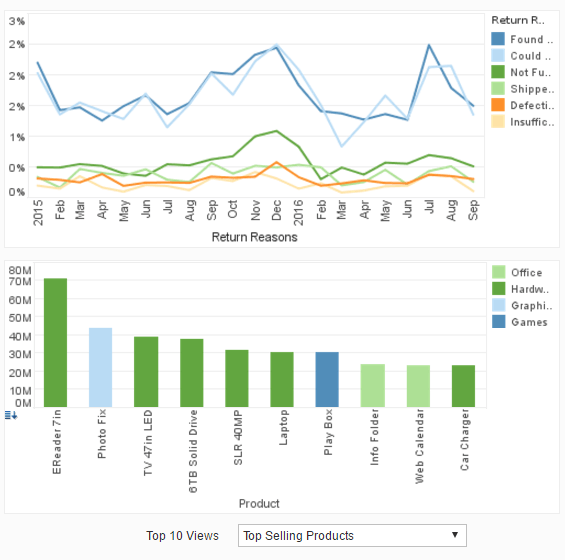
- Rich Multi-Dimensional Charting
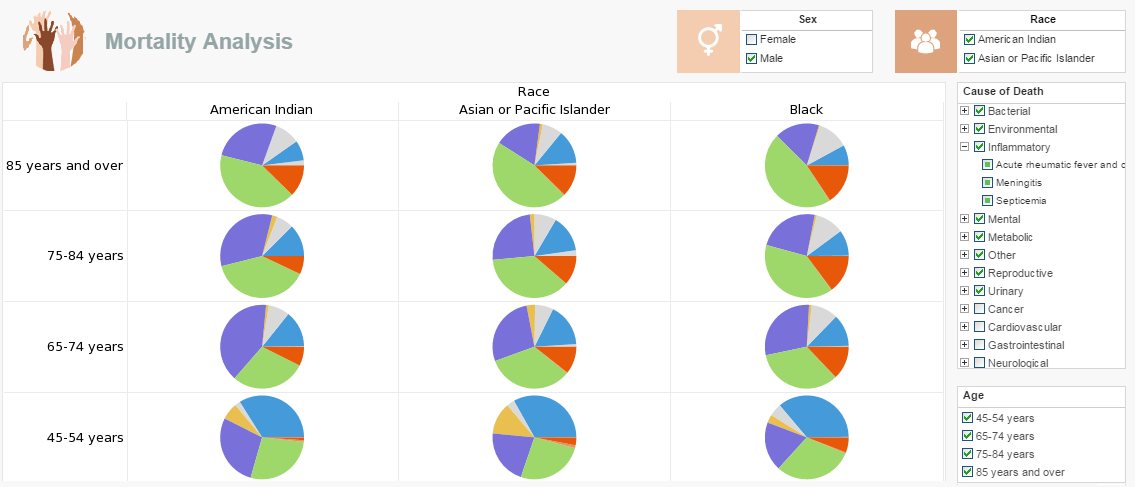
- Brushing for Data Exploration
- Co-located Multi-Charts
- Custom Geographic Data Binding
- Drag-and-Drop Dashboard Designer
- Multi-Source Data Mashup and Visualization
Architecture
InetSoft's patent pending Data Block technology, powered by Data Modeler and Asset Composer, enables speedy data access across a range of data sources including relational databases, multi-dimensional databases, Web services, flat files, and more.
More specifically, our StyleBI software already integrates the Data Block technology into the server. For database sources, it takes full advantage of database power by retrieving data directly from the original source or from pre-aggregated materialized views.
Data Access Features
- Access Multiple Data Sources - connect to relational databases, multi-dimensional databases, XML, SOAP, EJB, Java objects (POJO), flat files, etc.
- End-user Defined Data Mashup - combine data within a single data source or across multiple data sources into unified data sets using union, intersection, minus, inner/outer joins, etc.; simple drag-and-drop interface gives business users maximum self-service – a unique capability of StyleBI
- Reusability/Collaboration - reuse objects such as queries, worksheets, viewsheets, and report components for efficient team collaboration
- Virtual Private Model (VPM) - create virtual private models to limit data-level access by user, role, or group designation
- OLAP Overlay - create multi-dimensional hierarchies on top of a logical model
- MOLAP Cubes - supports Essbase, IBM DB2 OLAP Server, MS Analysis Service, and Oracle OLAP

Accessible Databases and More
What makes InetSoft's database visualization software so unique and powerful is the access to multiple databases. In order to utilize the full potential and power of our software, we believe users should not be limited with the amount of data they have access to. More data means more perspectives and options.
With our database visualization software, user's are granted access to numerous databases including relational databases (JDBC), multidimensional databases, XML, SOAP, Java beans (POJO), Microsoft Excel, flat files, SAP, PeopleSoft, JD Edwards, and Siebel CRM.
Data Mashup
A key capability of InetSoft's business intelligence software has always been the data mashup capability. Data mashup allows for users to combine disparate data, from our multitude of accessible databases (along with others), to be used together. It's a platform on operational BI with an intuitive user interface that accelerates the usage of BI. Requirements that include reporting, OLAP, scorecards, dashboards, visualization, and ad hoc analysis are all met in one unified application.
Visualize Free
InetSoft offers this web-based application for users seeking to test out the interface and features of a visual analysis tool. While the full potential of the software is not accessible, it does allow users to upload, create an interactive dashboard, and analyze using own data set and dashboard features.
Running a trial and evaluating Visualize Free will help users digest how easy it is to use our dashboard and reporting software. More importantly, users will get an idea of how powerful our 'brushing', along with other tools, are when data mining. It's the perfect tool when working with multi-dimensional data to spot any significant patterns.
Why hesitate? Go and test Visualize Free, a free visual analysis tool, to explore and present data that standard office software cannot handle.
