Database Visualization Tools
The data that lives in a database tells organizations what their best strategies are, what patterns or trends are emerging, helps them understand where they stand, and more - but only if employees and decision makers can clearly understand the data.
So, how do organizations come to fully understand all of that raw, static data? The answer is database visualization tools. They are powerful tools for organizations in any industry that present visual graphics and representations of statistical data.
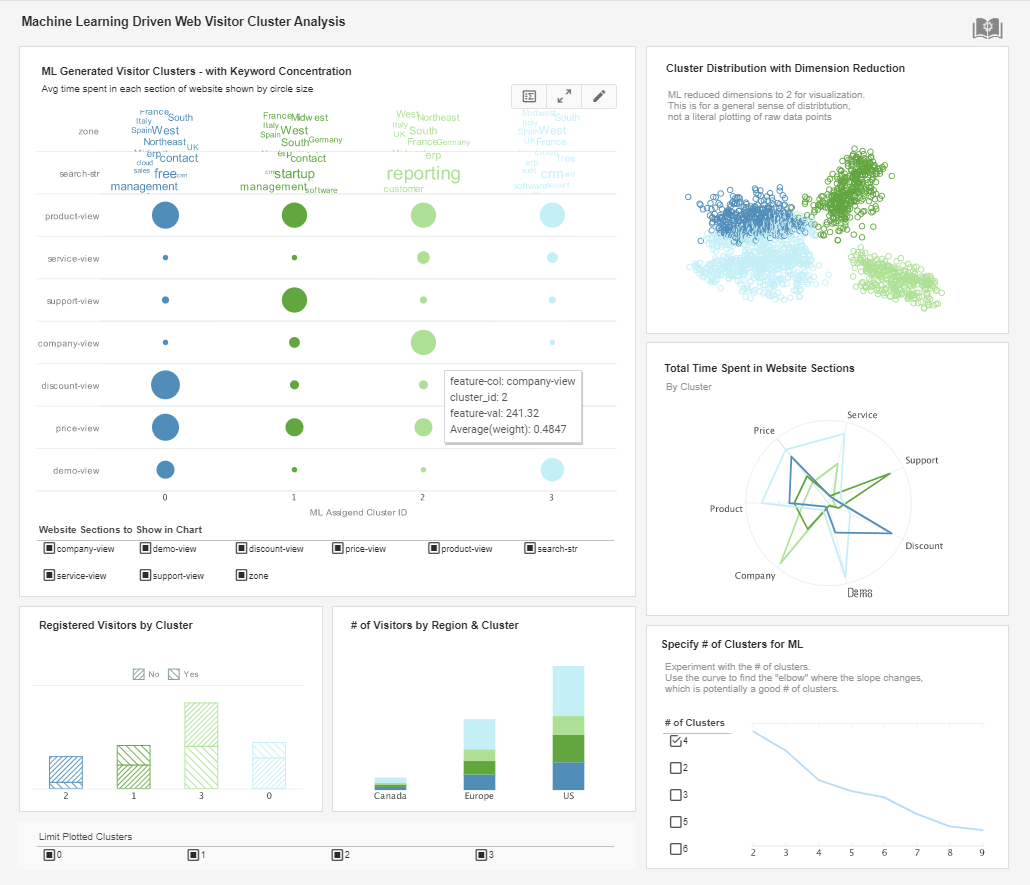
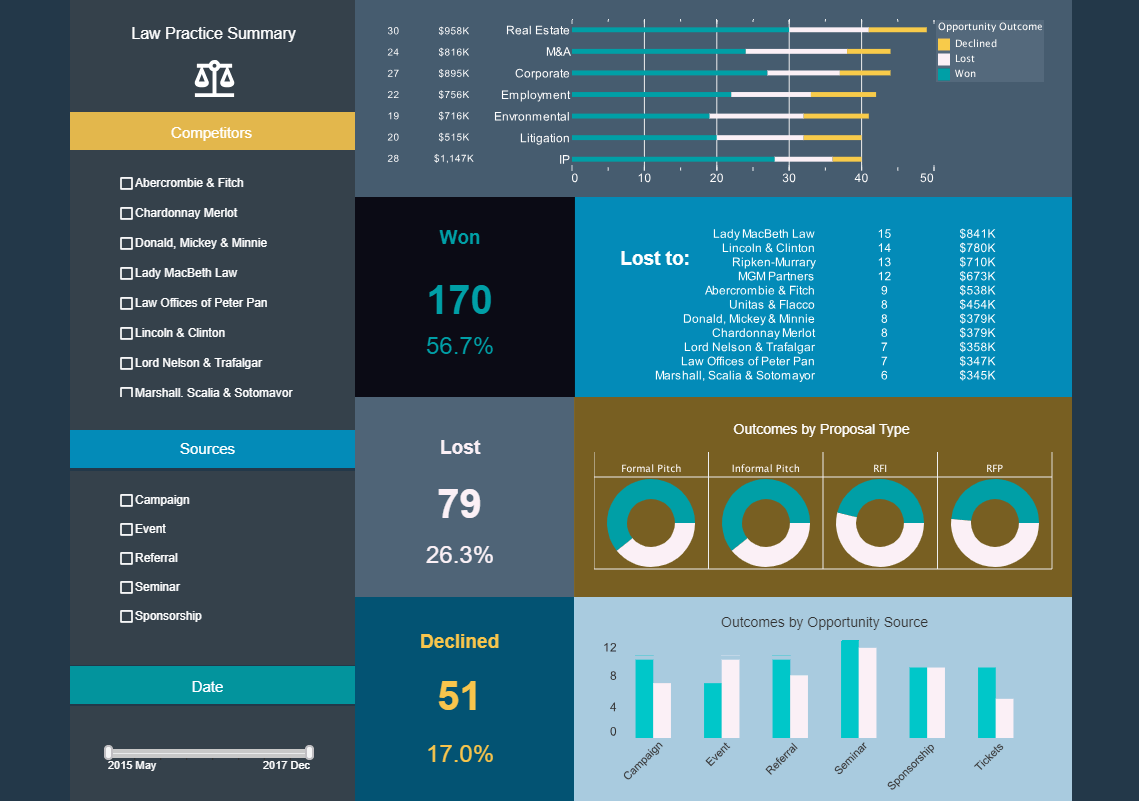
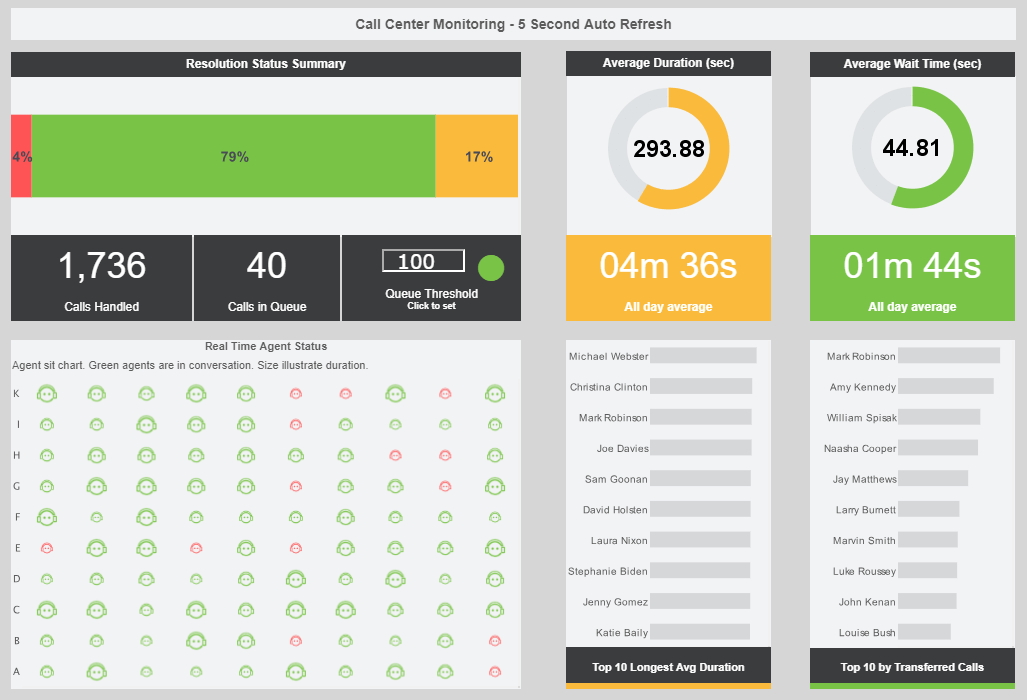
Visual representations are more effective for understanding the data therefore, personnel can communicate important messages more effectively and make better business decisions. The ability to visualize a database rather than reading reports or sifting through spreadsheets, allows organizations to explore the information they want in novel ways to create a more interactive and deeper analysis.
Visualization Environment
InetSoft's StyleBI offers sophisticated software for database visualization. StyleBI is a small-footprint Java-based business intelligence software that maximizes self-service. It is unified, easy-to-deploy, and easy-to-use.
Database visualization is most effective when it is purposeful, simple for all end-users, and when data can be "sliced and diced" for deep analysis to generate the best possible business strategies.
Purposeful
- Real-time data mashup
- Multidimensional charting
- Reaches all levels of enterprise to align all personnel
- Customized data for each user
Simple to use
- Drag and drop design
- Over 30 sophisticated chart types
- High performance scalability for large data sets
- Re-use and collaborate visuals
Interactive Analysis
- Drill down across views and into details
-Data mashup across domains and multiple data sources
-Brushing for data exploration
Database Connectivity
StyleBI's database visualization tools allow users to pull data from any location and in any format. This means all of an organization's data can be connected, and then presented to them in a dynamic way, in real time.
Example: An employee asks a manager about certain data relationships within the business before making an important business decision. Preceding visualization, the manager would have to spend lots of time sorting through data that they may not fully understand. With visualization the manager can quickly look at a dynamic graph or chart and provide an answer, based on real-time data, that aids an efficient decision.
Visualization makes data relationships distinguishable and most importantly, saves time. It also allows all users and decision makers to make new discoveries or spot trends so that the organization can stay 'ahead of the game.'
Data Analysis
With StyleBI, end-users can enjoy an easy, self-service, point and click environment. All users can control the data they would like to visualize, plus each user has a customized view of data based on their position in the organization.
Visualized analysis is constructed in real-time by dropping data items into visual elements such as charts, metrics and selections. The resulting visualizations reveal the intrinsic relationships among data and allow for easy apprehension of multidimensional data.
Further, StyleBI visualization enables writing back to databases. So now organizations can quickly build Web-based applications that both visualize or read data from almost any data source and provide controlled forms for updating or inputting information. Examples of such applications are data profiling, marketing lead import cleansing, sales quote approvals, and financial budgeting.
Database Visualization Reviews
"One of the biggest benefits we see with this product is our ability to react more quickly to potential problems that affect our bottom line by alerting us to crucial information on a real-time basis. This will allow us to respond very quickly to opportunities and take a more proactive approach to management. In addition to tracking financial data in real-time, we plan to create an interactive dashboard which will be used to identify and prevent health issues at the early stages. We believe our current use of this product is just the tip of the iceberg and we look forward to future applications.” - Brandon Depenbusch, GM of South Operations and Director of Research at ILS"
"We were very selective, having looked at about a dozen similar products. In the end, it was an easy choice because other offerings were unable to meet our fundamental requirements. We selected InetSoft on the basis that their product integrated well with our applications and business processes. In addition, and unique amongst similar solutions, the InetSoft products provided static as well as dynamic reporting, enabling our customers to investigate their data against pre-determined measurables. This functionality provides our customers with a powerful benchmarking tool to determine how many similar events have occurred over an established period, and whether they are increasing or decreasing in regularity, effectively measuring their safety programme against past performance.” - Martin Wimpress, IT Manager at Flight Data Services
"InetSoft’s StyleBI has allowed us to centralize our reporting while providing an intuitive design environment for our business users. We have reduced the time to build dashboards from weeks to days, and the ability to pull data from our multiple SQL Server and cloud accounting systems into a single, visually clear view has transformed how we deliver insights to our clients. Support has been responsive and technical resources are excellent, helping us tailor the platform to our exact needs." — IT Director, Mid-Sized CPA Firm


