Data Mining Made Easy with InetSoft
Cutting costs and increasing revenue is an established goal for all businesses. In order to accomplish this, data must be collected and then analyzed for any readjustments that must be made.That's where data mining comes in handy. So the question is what is data mining and how can it help?
Data mining is the process of finding patterns, trends, and relationships by interpreting raw data into meaningful information. This information can then be used effectively to make key decisions and/or predictions on future sales, inventory levels, customer response, etc.
'Mining' data requires sifting through a diverse field of relational databases for market research, report creation, and report analysis. This in turn can be used to sort and summarize any relations that are derived.
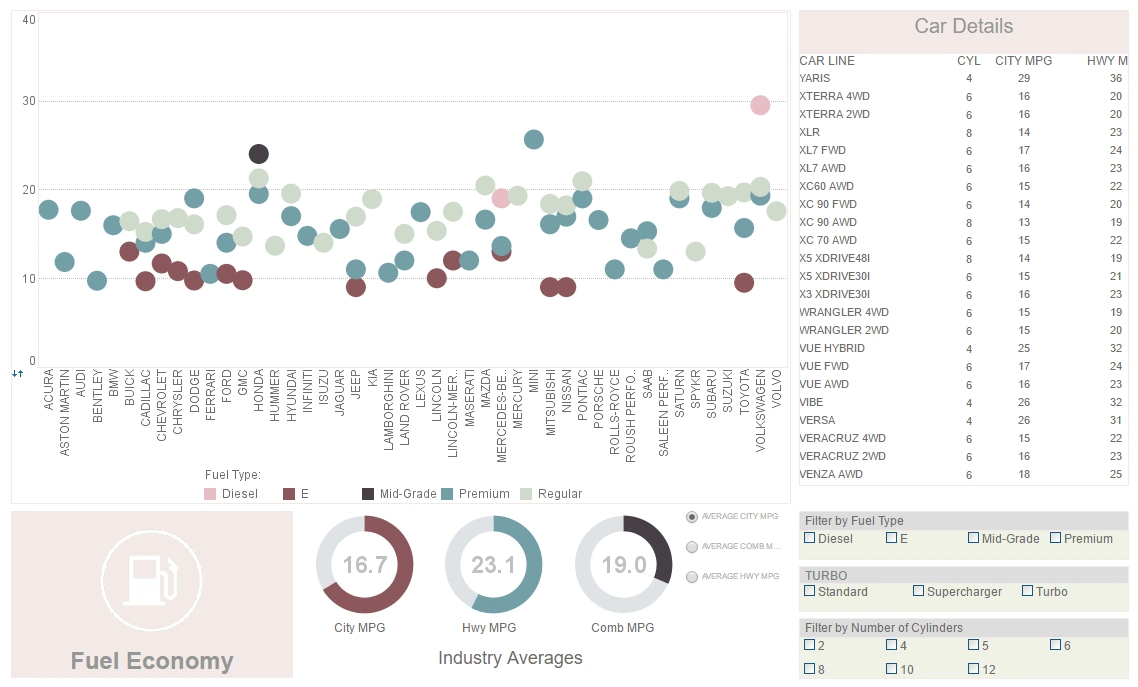
Included in InetSoft's award-winning dashboard solutions and reporting tools are our unique data mining tools which help users effectively analyze data sets. One key feature is our 'brushing' tool, a unique data exploration tool employed only by InetSoft, which allows users to select specific data and drill down by allowing them to have a closer and precise analysis on the chosen data set.


How StyleBI Makes Data Mining Easy for Marketing Professionals
Data mining is a powerful tool for marketing professionals, enabling them to uncover insights from vast datasets to drive targeted campaigns, optimize strategies, and boost ROI. However, the complexity of traditional data mining tools can be a barrier. StyleBI, a cutting-edge business intelligence platform, simplifies this process, making it accessible and efficient for marketers. By streamlining data extraction, analysis, and visualization, StyleBI empowers marketing teams to focus on strategy rather than technical hurdles.
User-Friendly Interface
One of StyleBI’s standout features is its intuitive user interface, designed with non-technical users in mind. Marketing professionals often lack the coding expertise required for tools like Python or SQL-based platforms. StyleBI eliminates this challenge with a drag-and-drop interface that allows users to query datasets, create reports, and visualize insights without writing a single line of code. This accessibility ensures that marketers can quickly dive into data analysis, saving time and reducing reliance on data science teams.
For example, a marketer looking to segment customers based on purchasing behavior can use StyleBI’s interface to filter data by demographics, transaction history, or engagement metrics. The platform’s guided workflows make it easy to set parameters and generate actionable insights, such as identifying high-value customers for targeted campaigns.
Automated Data Preparation
Data mining often involves time-consuming tasks like cleaning and structuring raw data. StyleBI automates these processes, allowing marketers to work with clean, organized datasets from the start. The platform integrates seamlessly with multiple data sources, including social media platforms, CRMs, and e-commerce systems, pulling in raw data and transforming it into analysis-ready formats. This automation reduces errors and ensures consistency, enabling marketers to focus on interpreting insights rather than wrangling data.
For instance, when analyzing social media data, StyleBI can automatically clean unstructured comments or posts, categorize them by sentiment, and organize them into datasets for further analysis. This capability is crucial for marketers aiming to understand customer sentiment or track brand mentions across platforms.
Advanced Visualization Tools
Effective data mining isn’t just about finding patterns. It’s about communicating them clearly. StyleBI offers robust visualization tools that transform complex datasets into digestible charts, graphs, and dashboards. Marketers can create heat maps to identify high-engagement periods, line graphs to track campaign performance over time, or pie charts to visualize customer segment distributions. These visualizations make it easier to present findings to stakeholders and align data-driven strategies with business goals.
A practical example is a retailer using StyleBI to analyze sales data. By visualizing purchase trends, marketers can identify which products are frequently bought together, enabling them to design cross-selling strategies or optimize store layouts. StyleBI’s customizable dashboards ensure that these insights are presented in a format tailored to the audience, whether it’s a C-suite executive or a campaign manager.
Actionable Insights for Marketing
StyleBI goes beyond data processing by focusing on actionable outcomes. Its machine learning algorithms identify patterns, correlations, and trends that directly inform marketing strategies. For instance, StyleBI can detect emerging trends in customer behavior, such as a growing preference for eco-friendly products, allowing marketers to pivot campaigns accordingly. The platform also supports predictive analytics, helping teams forecast campaign performance or customer churn.
Moreover, StyleBI’s integration with marketing tools like HubSpot or Google Analytics enables seamless data flow, ensuring that insights are immediately applicable. Marketers can use these insights to refine ad targeting, personalize customer experiences, or optimize budget allocation, all while staying within a single platform.
Good Strategies for Data Mining
- Make sure all data sets that are being used are compatible, easy to use, and organized. Consistency and organization help create an effective and efficient process throughout.
- Key attributes in the data help ease the process. Look over entire data set and make sure to record any relevant attributes that haven't been included. Missing key components limits the accuracy of resulting predictions.
- Unnecessary data and/or errors in the data can exist. Perform a thorough audit of the data to omit any fruitless information.
- Quality over quantity. Having quality data is more beneficial than having a large set of data. Large amounts of data can elongate the process as a whole.
- Understanding the data. Make sure you or someone looking at the data is an expert. A thorough understanding of the data helps identify relevant attributes, patterns, and relationships.
- Plan, organize, and follow through. Because data mining can become a complicated process, it is crucial to plan beforehand, stay organized throughout, and execute the plan.
- Mining in an actual field requires miners to have a road map that helps define and guide them through any critical issues and makes sure all important points are addressed. Without a map laid out beforehand, miners are bound to get lost in the digging process.


Best Practices When Data Mining
- Don't be lazy. Take time to learn and comprehend the data instead of solely relying on a piece of software to do all the work.
- Know what you're looking for and trying to figure out. Having a goal will allow you to focus on that goal until the end. Applying software to find irrelevant data would be considered a waste of time
- Learn to familiarize yourself with effective processes that incorporate similar data through any data mining process. This way allows for easier implementation.
- Constantly re-evaluate existing processes and models.