Evaluate InetSoft's Freshsales Dashboarding Tool
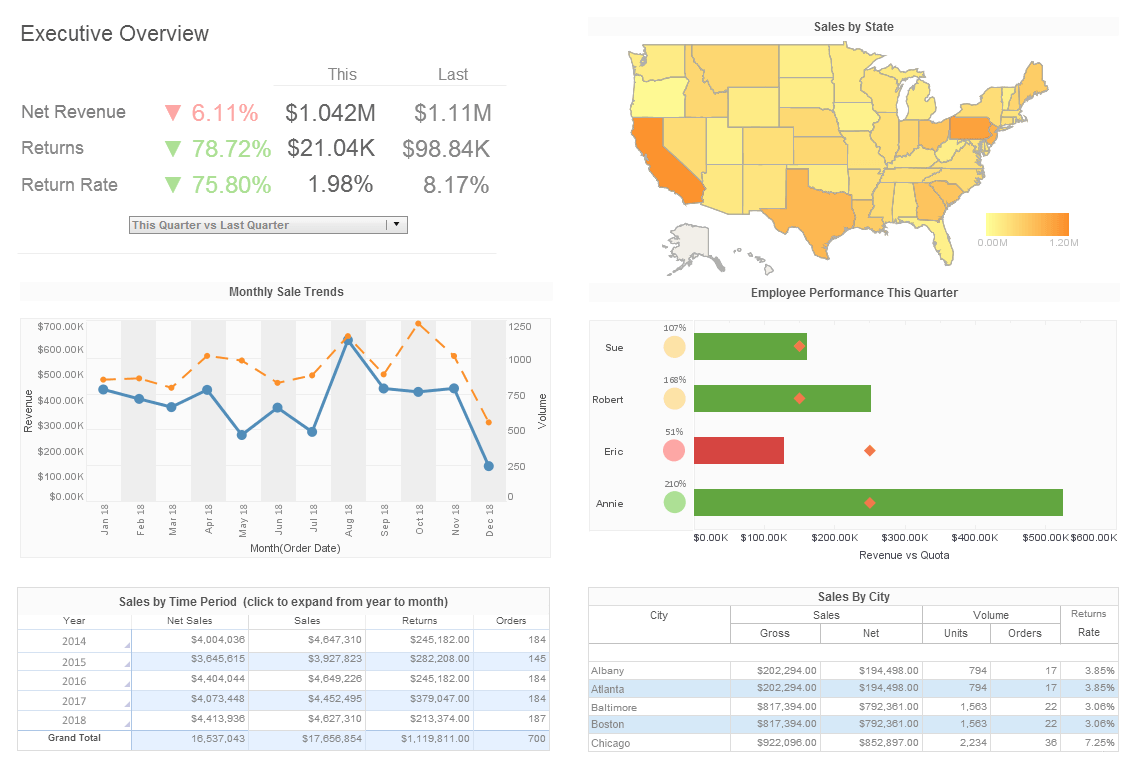
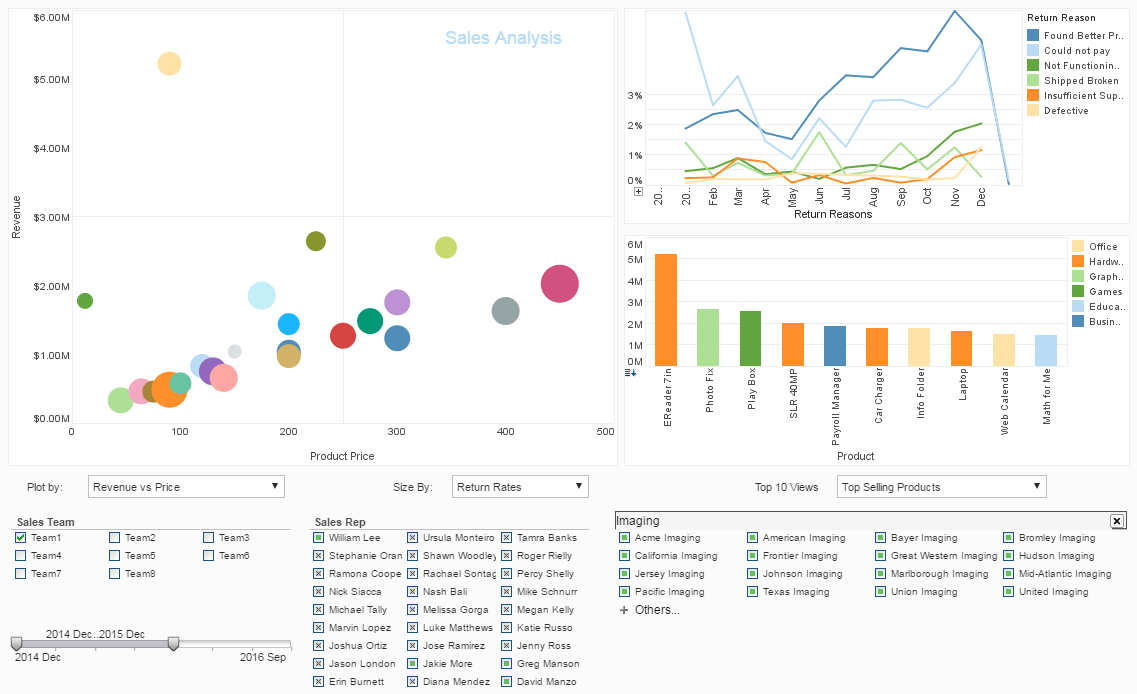
Are you looking for a good solution for Freshsales dashboard reporting? InetSoft's pioneering BI application produces great-looking cloud-based dashboards with an easy-to-use drag-and-drop designer. Mashup your sales and other enterprise data for a wider view of performance. View a demo and try interactive examples.

Register for more information and a personalized demo
About InetSoft
Since 1996 InetSoft has been delivering easy, agile, and robust business intelligence software that makes it possible for organizations and solution providers of all sizes to deploy or embed full-featured business intelligence solutions. Application highlights include visually-compelling and interactive dashboards that ensure greater end-user adoption plus pixel-perfect report generation, scheduling, and bursting. InetSoft's patent pending Data Block™ technology enables productive reuse of queries and a unique capability for end-user defined data mashup.
This capability combined with efficient information access enabled by InetSoft's visual analysis technologies allows maximum self-service that benefits the average business user, the IT administrator, and the developer. InetSoft was rated #1 in Butler Analytics Business Analytics Yearbook, and InetSoft's BI solutions have been deployed at over 5,000 organizations worldwide, including 25% of Fortune 500 companies, spanning all types of industries.

More Resources and Articles about InetSoft's Freshsales Dashboarding Tool
Bring Dashboards to Your Big Data - InetSoft's StyleBI drops into an existing Apache Spark installation. This bring-the-software-to-the-data approach eliminates costly big data movement for analytics and reporting. StyleBI can also be deployed with its own built-in Spark cluster...
| #1 Ranking: Read how InetSoft was rated #1 for user adoption in G2's user survey-based index | Read More |
Business Web Dashboard Examples - Below are examples of dashboards built with InetSoft's Web dashboard software, some of which you can try out with the free downloadable 5-day evaluation copy of StyleBI...
Capture Graphic KPI's - The best way to capture graphic KPI's is through dashboard software. InetSoft's graphic KPI dashboards leverage KPI's by providing a dynamic, easy to understand visual display of an organizations most important metrics...
Dashboard Reporting Services Examples - Looking for reporting services dashboard examples? InetSoft's pioneering reporting application connects to SQL Server and generates great dashboards. View a demo and try interactive examples...
Dashboard Software to Monitor Your Small Business - For small businesses owners working to improve productivity and increase profit, interactive dashboards can be a huge aid in gaining a visual perspective of the health of an organization. Unfortunately, many BI vendors have high entry points for their software, pricing themselves out of the market for small businesses...
 |
View live interactive examples in InetSoft's dashboard and visualization gallery. |
Demonstration of Financial Reporting Software - One thing you can all see from this financial reporting software demonstration is that when we were writing those reports, everything is immediate. So every time we did a recalculation, every time we were looking at those dropdown menu items, it was looking directly at your database live. Now we are going to walk you through creating some human resource reports. What we are going to do now is spend some time presenting some of the same functionality but from the HR perspective. I think this demo will show how simple our query and analysis tools is. Even a marketing guy like myself can write HR reports...
Detailed Business Intelligence Dashboard Examples - Looking for business intelligence dashboard examples? InetSoft offers award winning dashboard solutions. InetSoft's dashboard tool requires no expensive BI experts or consultants to deploy and offers an intuitive point-and-click, highly visual, easy-to-use interface...
Examples of Database Dashboards - Is your business using database dashboards? These dashboards offer companies a unique way of representing their data. From sales projections, to employee statistics, and even inventory stock, database dashboards are able to easily represent all of the numerical data that your company can hold, into a visually appealing dashboard. Dashboards come in various different styles and presentations, and choosing the correct one can greatly affect your business...
Learn to Make Dashboards - The first thing to learn about any BI platform is how to make dashboards. InetSoft knows this and has designed the perfect dashboard builder. InetSoft's core philosophy has been create an application that is powerful but easy to use. To the right here you can see one the fully interactive dashboards that was built using InetSoft software solution...
 |
Read the top 10 reasons for selecting InetSoft as your BI partner. |
Learning about Key Performance Measures - Key Performance Measures (KPMs) are business metrics that are used to track an organization's performance. Any industry, government agency, or non-profit organization needs to measure its performance on a daily, monthly or quarterly basis, and key performance measures are those statistics that are deemed important to track in order to meet business goals or organizational objectives...
New Online Interactive Dashboard - Looking for a new way to keep track of performance and improve overall efficiency of any task? InetSoft's online interactive dashboard software has proven to be a highly effective business tool for both monitoring and analyzing data to meet the queries of any user...
Options for Embedded Dashboards - InetSoft's award-winning dashboard software application offers an expansive list of embeddable dashboard options that provide users with more reporting options than are typically found in most business intelligence solutions. View the example here to learn more about the StyleBI solution...
Performance Management through Visualizations - Dashboards are well-defined methods of monitoring, measuring, and managing performance by tracking metrics. InetSoft dashboards offer users the advantage of actionable business intelligence...
Read what InetSoft customers and partners have said about their selection of Style Report as their production reporting tool. |
View Business Dashboard Examples - Below are examples of business dashboards built with InetSoft's business dashboard software, some of which you can try out with the free downloadable 5-day evaluation copy of Style Intelligence...
Visualization Dashboard Examples by Department - Click on an image to open one of these live interactive dashboards in a new tab. These industry specific visualization dashboards allow you to get a feel for how easy it to use InetSoft's dashboard software...
Visualization Product Example - This is a table of contents of useful product information about, and benefits of, InetSoft's visualization capabilities built into its business intelligence software for dashboards, reporting, and analytics...
Web 2.0 Dashboard Product - Searching for information about Web 2.0 dashboards? InetSoft's HTML5-based dashboarding software is highly interactive and easy enough to use that business users can explore much data on their own. View a demo...
Read what InetSoft customers and partners have said about their selection of Style Scope for their solution for dashboard reporting. |
What Does Operational Business Intelligence Mean? Historically people viewed enterprise data warehousing and BI environments as a resting place for data. Now, operational is added to differentiate those types of business intelligence from a real-time environment that is aimed at driving data and analytics and ad hoc data exploration where in the organization that it needs to be, when it needs to be there...
Why Credit Union Managers Use Dashboards - Credit union managers have a variety of tasks that are part of their job description. Some of those tasks include financial reporting, training, and onboarding staff, as well as marketing and sales. Everything they do has to be data-driven and even their marketing and sales approach should include data-backed storytelling...
Writing a Financial Report - For this example of writing a financial report, select company 100. Double click. It completes the filter. And then, go down, and say you want the current accounting year. Drag and drop that into the filter area. Complete that information. At this point you're almost finished. There are some predefined report styles that you can choose from. So as you can see there's the classic one. There's an accounting presentation, but for this report select 3D effect...


