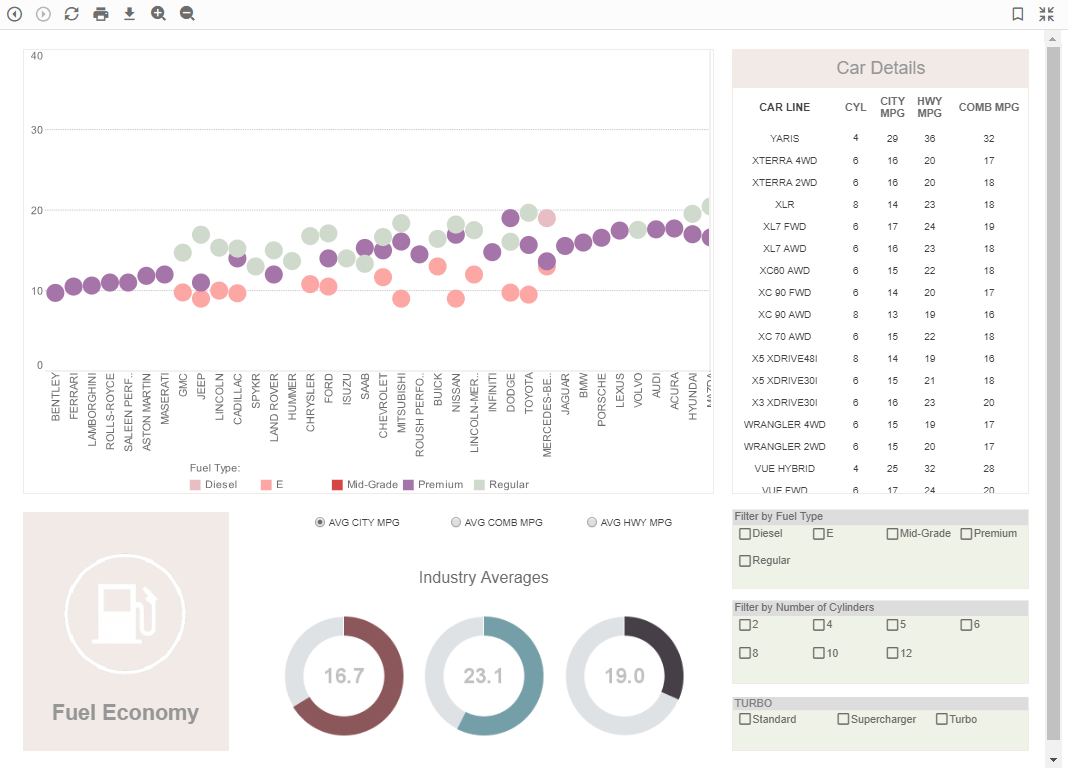
InetSoft's Interactive Green Car Dashboard
The Green Car Dashboard is an interactive browser-based visualization that allows users to filter through thousands of vehicles to find the most environmentally sound options available. This is a free interactive dashboard from InetSoft, an innovator in dashboard, reporting and data mashup solutions, and is built using InetSoft's Visualize Free application. Visualize Free is a free cloud-based version of InetSoft commerical data intelligence software, StyleBI.
 |
View a 2-minute demonstration of InetSoft's easy, agile, and robust BI software. |
What Can You Do With This Interactive Dashboard?
- Filter by vehicle class, make, model, and much more to display multiple simultaneous results derived from the latest EPA reports.
- Analyze charts and graphs and then select other tabs to see other views of the data that was selected.
About Visualize Free
Compared to searching through the hundreds of competing car manufacturer and information websites, this visual analysis tool allows users to find information almost instantly.
The Green Car Dashboard has been deployed using Visualize Free; a free visual analysis tool based on the advanced commercial dashboard and visualization software developed by InetSoft. Visualize Free permits anyone to upload and sift through multi-dimensional data to spot trends and aberrations or slice and dice data with simple point-and-click methods, and gives users the option to share their visual analysis with others or keep it private. To try Visualize Free, please visit www.visualizefree.com.
