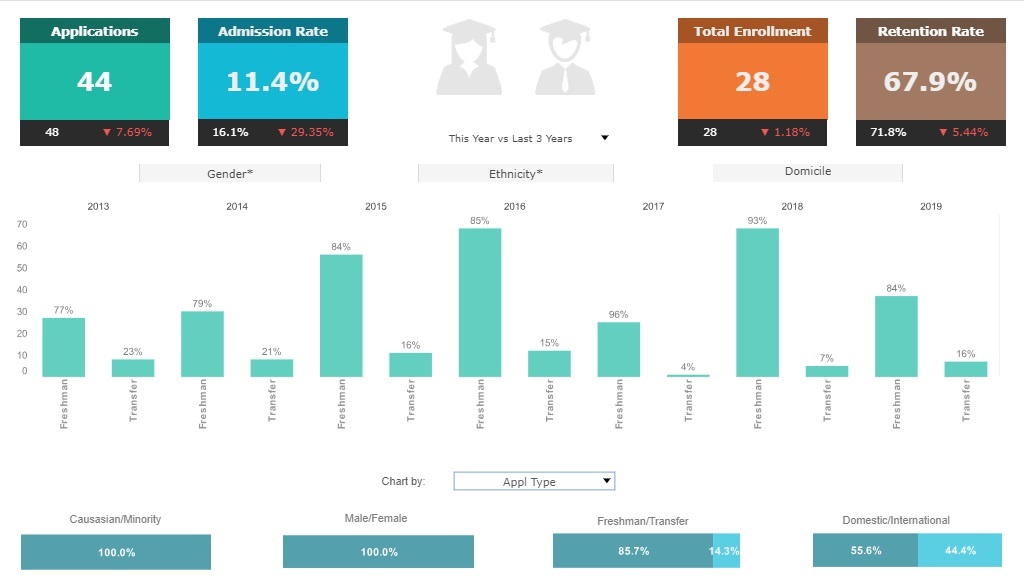
Information about Scorecards and Scorecard Examples
Managers and business owners have a number of tools available to measure and manage their company's performance. One of the most effective and widely used tools is the balanced scorecard.
Scorecards are customizable structured reports that compare actual performance figures (financial and non-financial) to desired performance figures, which are pre-determined by management. Ideally, scorecards reveal the gap between where your company is today and where your company wants to be tomorrow.
In some ways, a balanced scorecard is just like a baseball card. In order to judge the effectiveness of a player, baseball analysts use a variety of key performance indicators (KPIs), which are simply the most relevant metrics within an industry or organization.
If you want to gauge a player's performance, just turn the card over and you can take a look at their KPIs. The same applies for businesses and organizations. If you want to know how a business is performing, take a look at the balanced scorecard.
| #1 Ranking: Read how InetSoft was rated #1 for user adoption in G2's user survey-based index | Read More |
If a scorecard only gave managers a snapshot of their company's performance at a specific time period, it wouldn't be very useful. A scorecard enables managers to benchmark performance by comparing KPIs to a specified goal, aptly referred to as a "target." Industry experts have suggested that the most important factor in setting up a balanced scorecard is choosing the "right" KPIs to monitor and benchmark performance.
This point is made clear in the popular book Moneyball: The Art of Winning an Unfair Game by Michael Lewis. The book talks about how the managers of the Oakland A's were faced with the difficult challenge of recruiting talented players on a limited budget. Historically, baseball teams have paid top dollar to recruit players who rank high on industry accepted KPIs.
In light of their sparse resources, the managers of the Oakland A's chose different KPIs to gauge the effectiveness of a potential recruit. The result was that the new KPIs served as a much more realistic measure for identifying and recruiting good players based on an a limited budget.
The lesson for businesses should be clear: choosing the wrong KPIs can lead to a situation where resources are not being distributed in the most efficient manner. Selecting the right metrics for a balanced scorecard is a process that requires several analyses to understand where your business stands in the competitive climate and what your short and long-term goals are. For example, if your long-term business strategy involves taking market share from the industry leader, then your relevant metrics for gauging performance would be very different from a firm whose strategy involves satisfying the needs of a niche market.Scorecard Examples
Financial Scorecard Example - In the example to the right, the Salesperson Scorecard displays sales figures and sales goals
Customer Scorecard Example - A scorecard can compare customer retention and satisfaction rates with desired
rates
Internal Scorecard Example - In this example a balanced scorecard will show the speed of processes across and
within different functional departments
Growth Scorecard Example - Compare employee turnover and job satisfaction rates to managerial benchmarks
More BI Scorecard Examples
Below are some scorecard examples to give you a look at some of the advanced displays that can be created using Style Intelligence. Style Intelligence can be used to build visualizations for any type of department or industry. These visualizations can be built by nontechnical users with a basic Excel level understanding of data.
Customer Service Scorecard
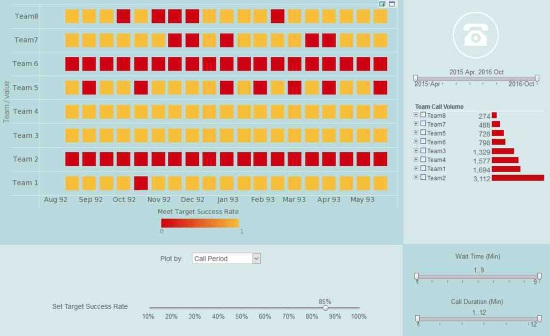
This customer service scorecared makes it easier for call centers to measure the effectiveness of their customer service teams. A red highlight shows when teams fall below goals on call period, call time, call status, and wait time. A slider adjusts the target success rate, so that managers can adjust the goals for effective customer service based on employee experience level and various conditions.
Marketing Leads Scorecard
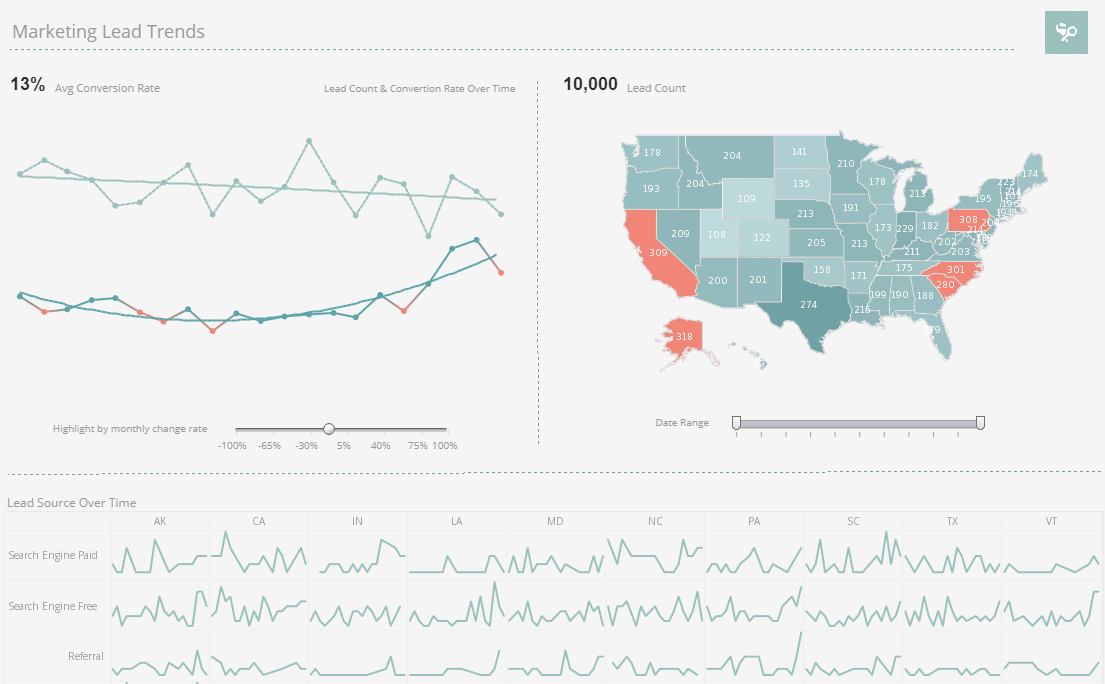
This marketing leads scorecard compares lead volume and conversion rates against benchmarks set by marketing managers. A large map chart displaying new leads by state displays states with lead amounts that reach goal in a different color. A line chart showing lead conversion rate shows a red highlight when conversion rate dips by too large an amount. A slider below the line charts modifies the change rate that results in a chart highlight.
Executive Sales Scorecard
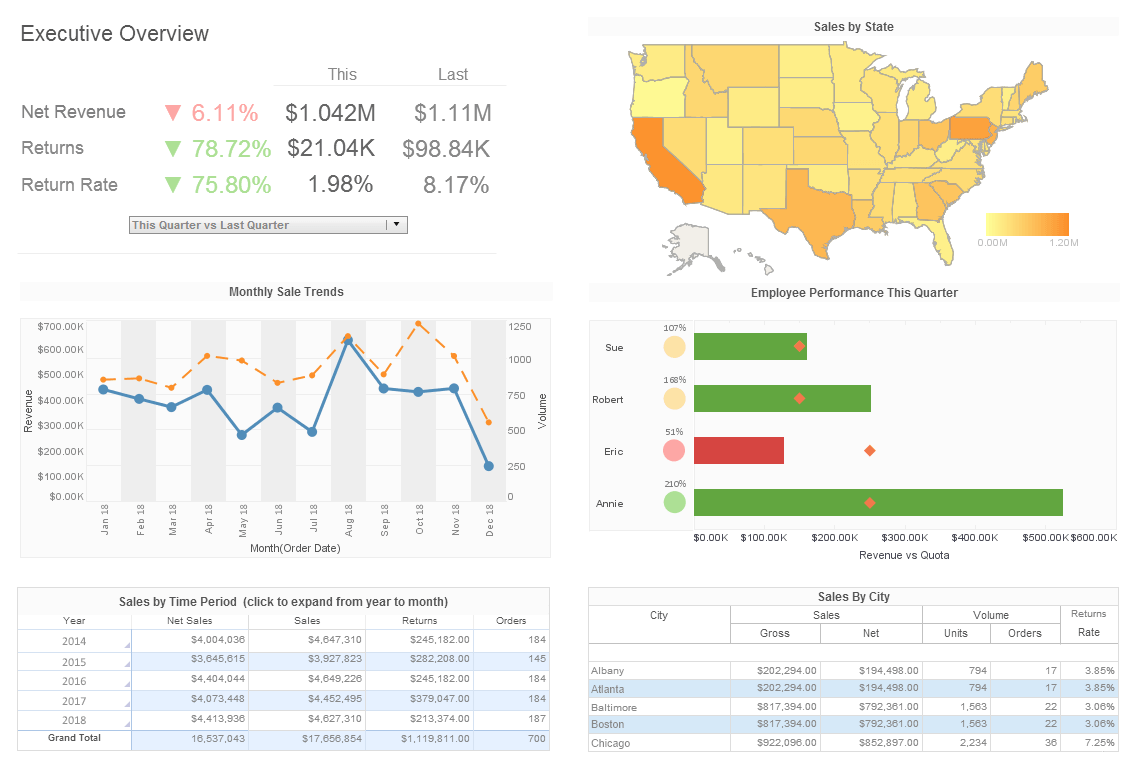
This executive sales scorecard gives executives an overview of sales by area, time period, and salesperson. The Employee Performance by Quarter chart displays employee sales relative to their quota, with bars turning red when performance lags behind the goal.
Marketing Project Management Scorecard
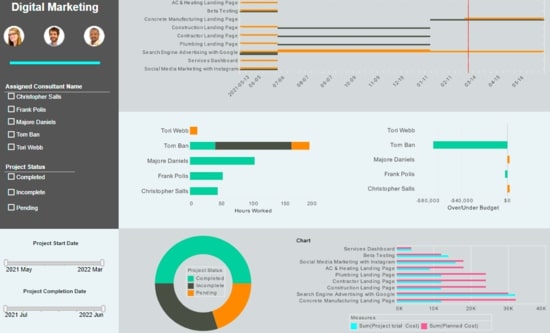
This project management scorecard tracks the status of various marketing projects and compares them to a goal completion date, displayed with a red line. Actual cost of projects is compared to planned cost, so managers can ascertain whether or not marketers are delivering on their promises.
Call Center Scorecard
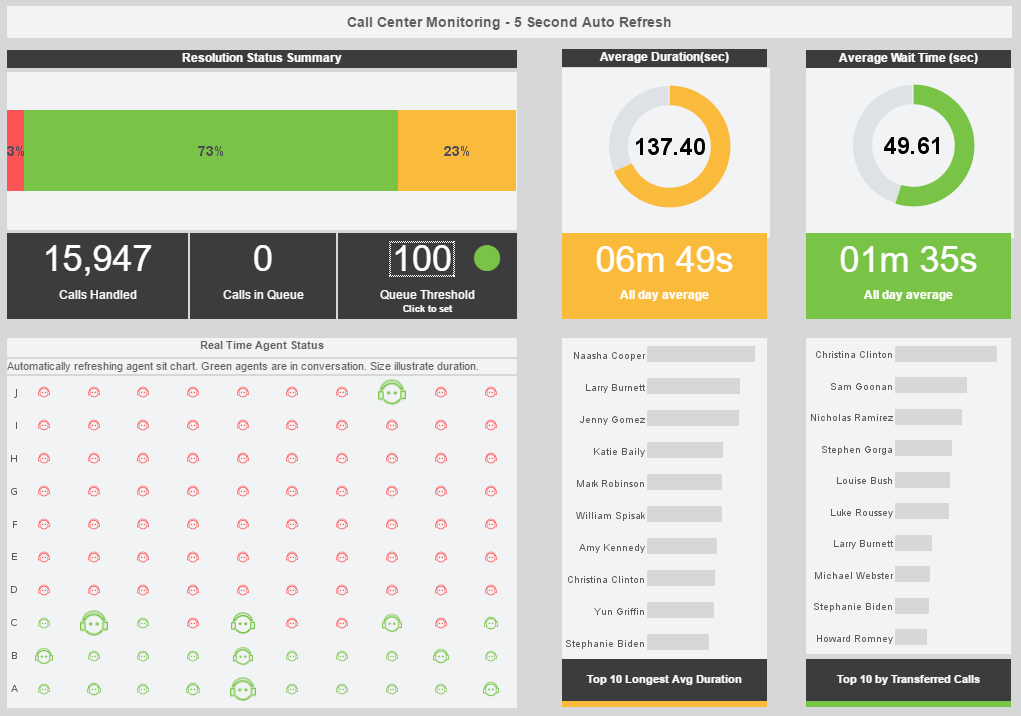
This live corporate call tracking scorecard helps call center managers supervise their customer service reps and monitor how their call and wait times compare to goals. An adjustable threshold turns from green to red when there are too many calls in queue. An agent status chart shows, in real time, who is on the phone and for how long. Large KPIs provide the daily call and wait time average, giving managers an at-a-glance picture of customer service quality.
Corporate Orders Scorecard
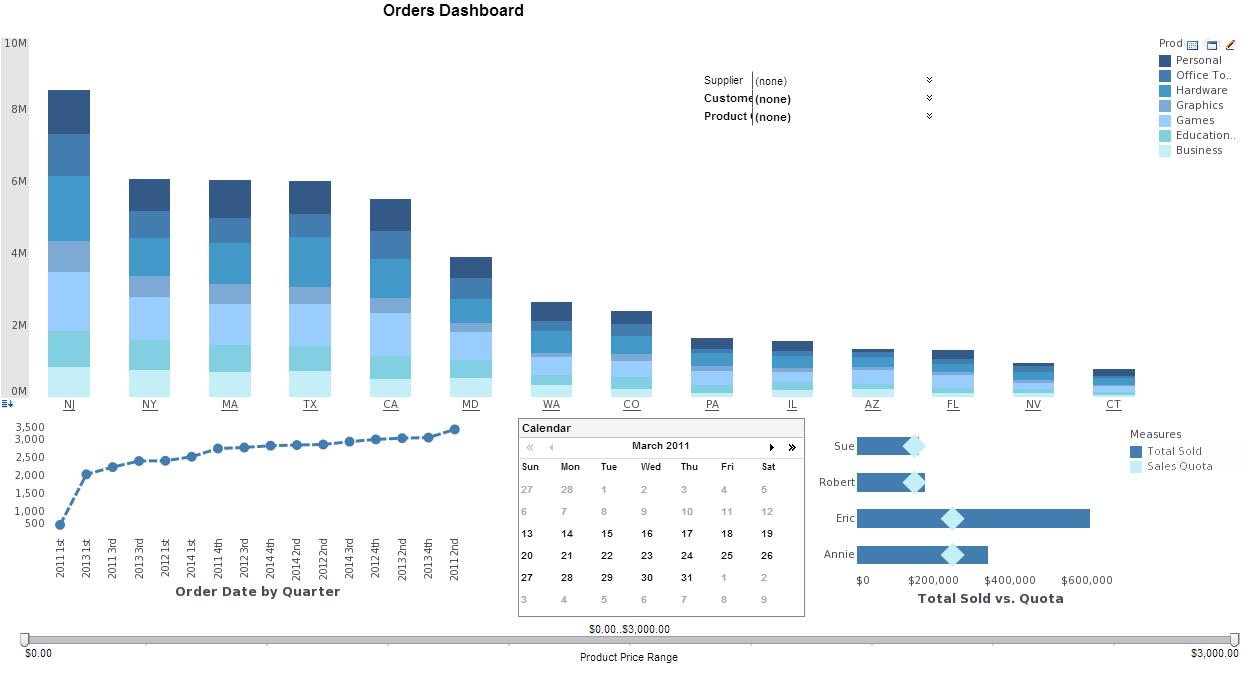
This orders scorecard breaks down orders by state, date, and sales team member.
A bar chart displays the orders sold by each salesperson, with a diamond shape representing their goals, for easy comparison.
A calendar display enables drilldown by individual week or month.
Why InetSoft?
InetSoft's dashboard and scorecard tools require minimum specialized IT expertise to deploy, require no expensive BI experts or consultants, and offer an intuitive point-and-click, highly visual, easy-to-use interface. InetSoft's scorecard tools empower business users with maximum self-service ability.
InetSoft has earned its reputation of excellence as a leading global operational business intelligence solution provider by delivering innovative, award-winning software and professional services for over a decade. InetSoft serves over a million users worldwide, including 25% of Fortune 500 companies.
