Internet Reporting Software
Web-based reporting software offers users flexibility that desktop applications cannot match. InetSoft's StyleBI is a zero-client tool for internet reporting. As such, it has many benefits over its desktop-bound competitors.
Benefits of Web-Based BI
StyleBI does not require powerful hardware to run properly. In fact, there is no processor speed, GPU, or RAM requirements to run StyleBI. Any Web browser has the capability to run the software.
This of course means that mobile browsers are supported by StyleBI, as well. Android tablets, iPhones, iPads, and any other device with a browser is fully capable of running StyleBI, allowing users access to dashboards and reports on the go.
Online applications let users share information with any number of end users, at home or abroad, with minimal labor. They permit users to send reports and dashboards to all those involved, drastically increasing the speed of decision making and, in turn, efficiency of a business.
| #1 Ranking: Read how InetSoft was rated #1 for user adoption in G2's user survey-based index | Read More |


The InetSoft Advantage
In order to stand above the rest, InetSoft's StyleBI platform presents several innovations above the capabilities of the typical Web-based BI model.
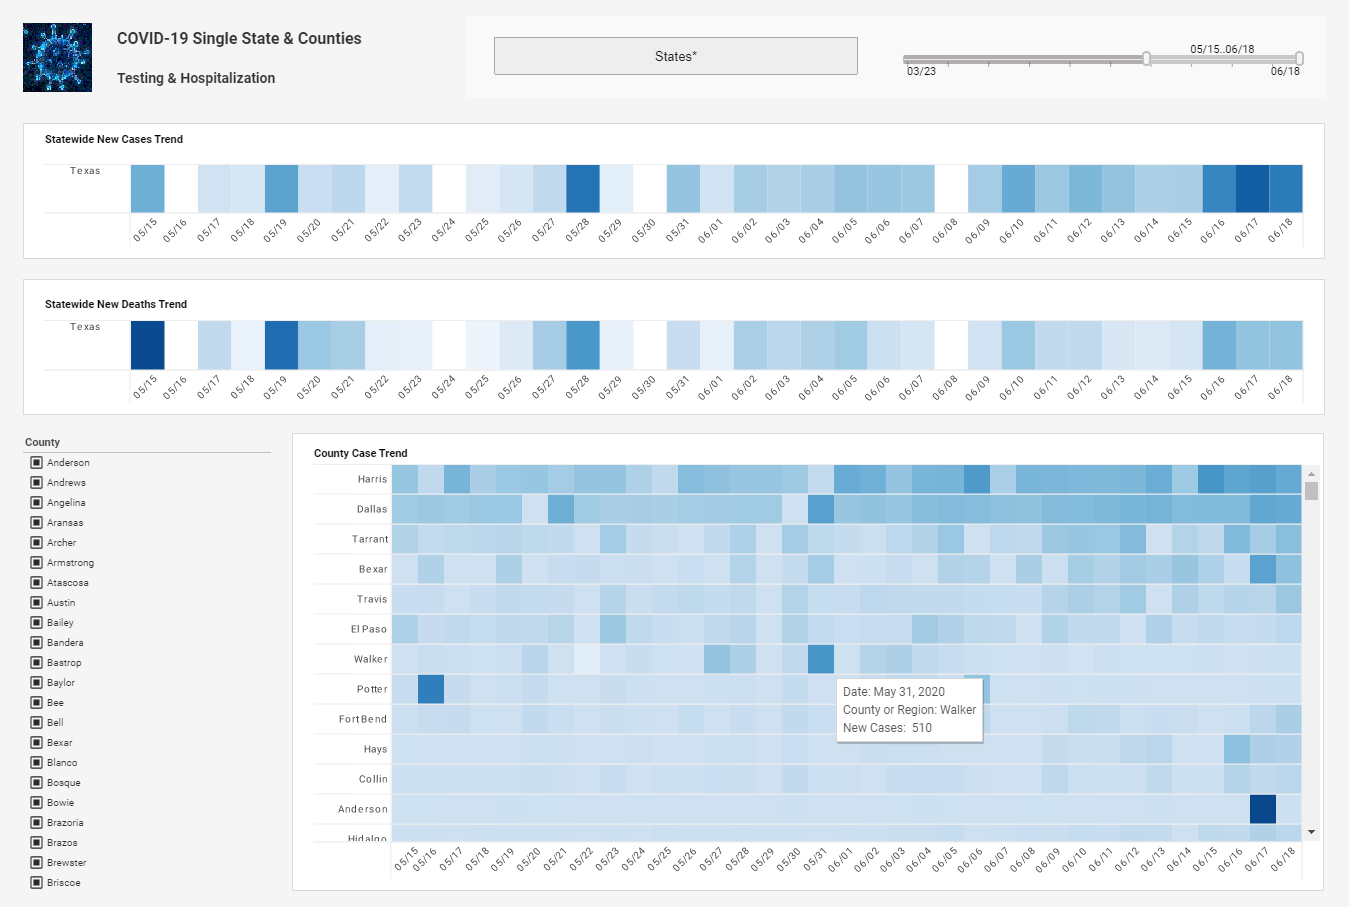
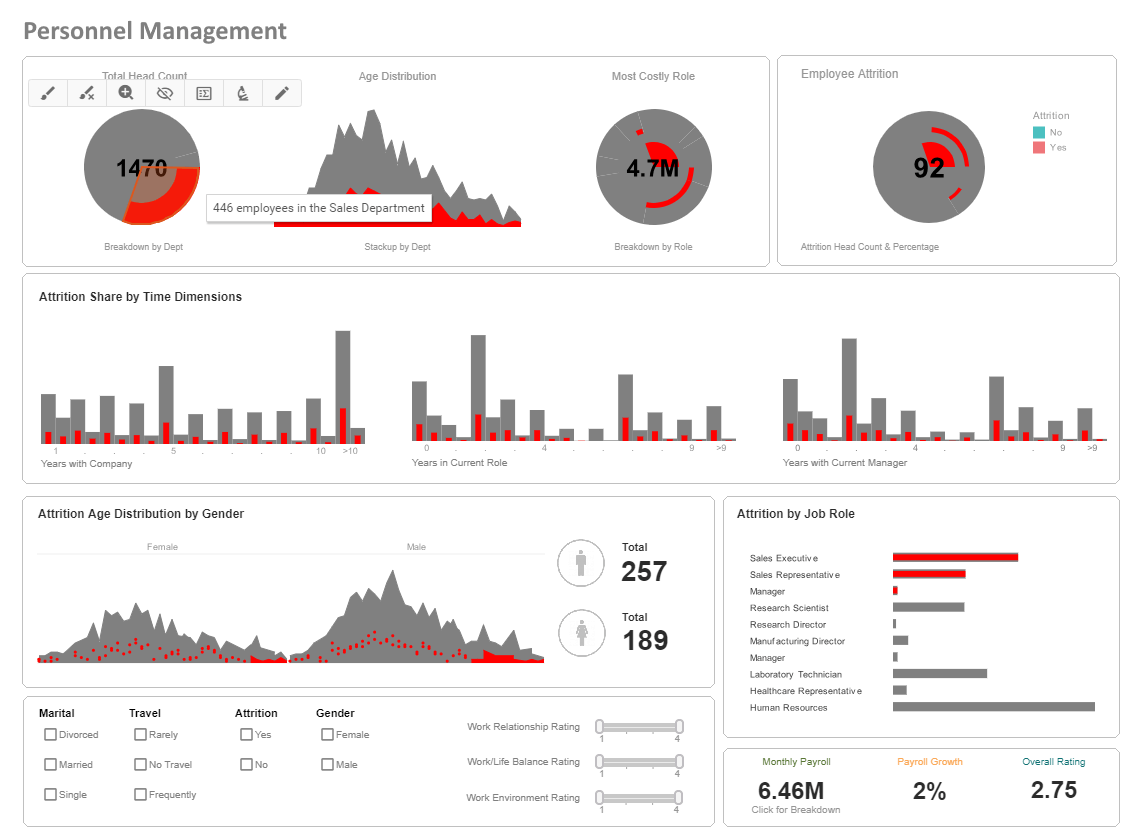
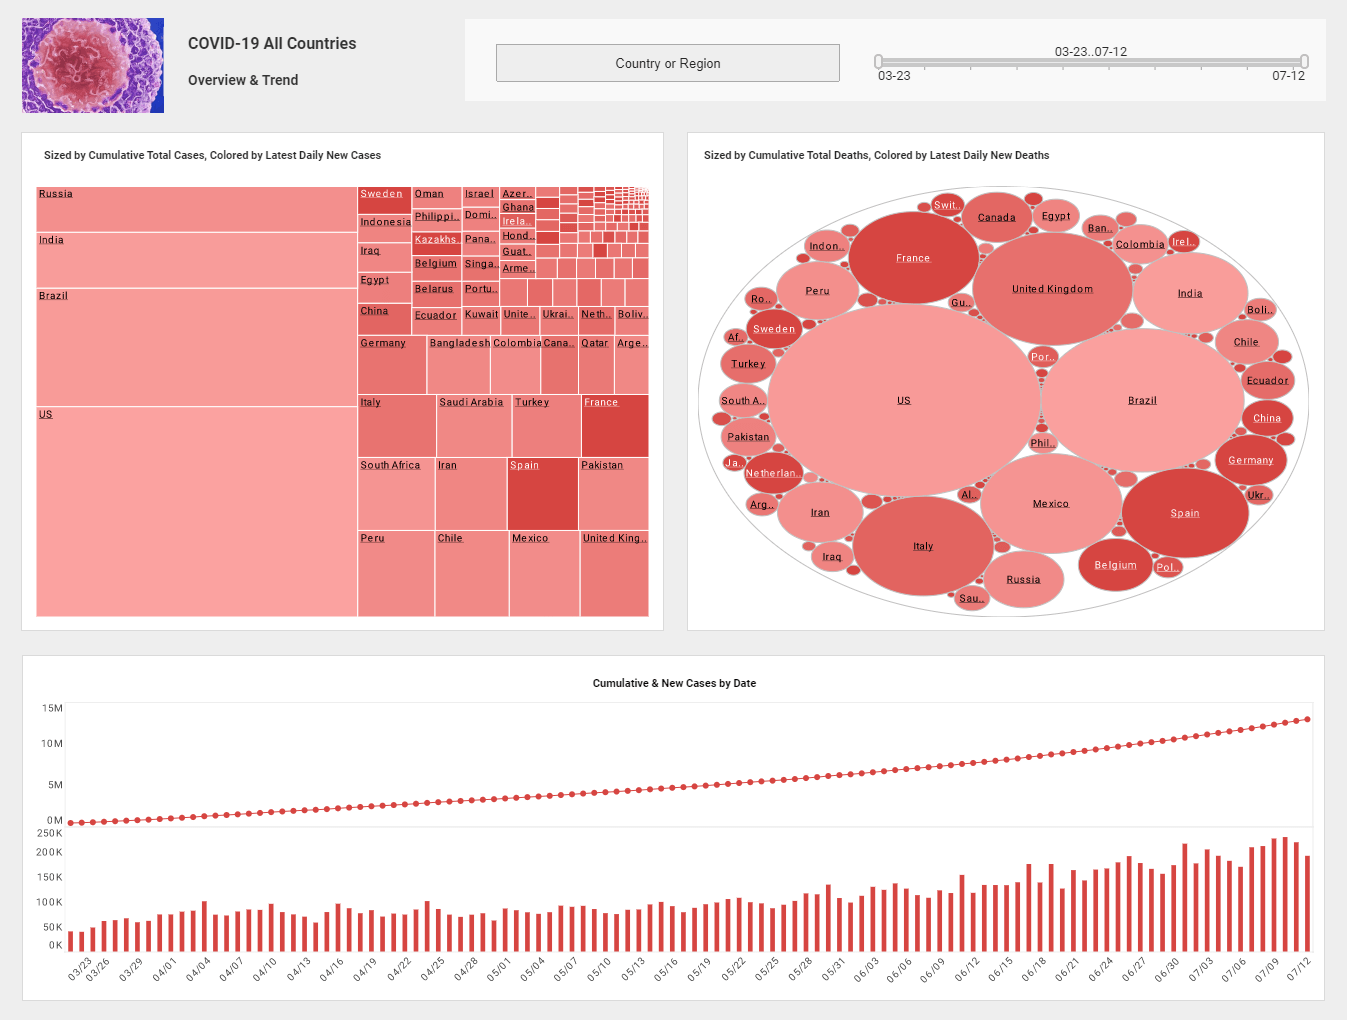
InetSoft StyleBI™ is an operational business intelligence platform that features a powerful data mashup engine for the creation of dashboards, visual analyses, and reporting. The unified, easy-to-deploy, easy-to-use business intelligence solution maximizes self-service and serves both enterprises and solution providers.
InetSoft's BI software leverages a powerful patent-pending Data Block™ foundation for real-time data mashup and presents information through interactive dashboards, enterprise reporting, scorecards, and exception alerts.
In contrast to other business intelligence applications that provide only reporting, or only dashboards, or require an intermediate data access layer, InetSoft's business intelligence system is complete. It includes analytics software and sophisticated reporting capabilities plus direct access to almost any data source.
The small footprint, SOA and Java architecture delivers an embedding and integration ready platform that delivers analytic business intelligence within business processes.
About InetSoft
Since 1996 InetSoft has been delivering easy, agile, and robust business intelligence software that makes it possible for organizations and solution providers of all sizes to deploy or embed full-featured business intelligence solutions. Application highlights include visually-compelling and interactive dashboards that ensure greater end-user adoption plus pixel-perfect report generation, scheduling, and bursting.
InetSoft's patent pending Data Block™ technology enables productive reuse of queries and a unique capability for end-user defined data mashup. This capability combined with efficient information access enabled by InetSoft's visual analysis technologies allows maximum self-service that benefits the average business user, the IT administrator, and the developer. InetSoft solutions have been deployed at over 5,000 organizations worldwide, including 25% of Fortune 500 companies, spanning all types of industries.

What Reporting KPIs Does a Chemical Process Operator Track?
Chemical process operators play a crucial role in ensuring the efficient and safe operation of chemical manufacturing processes. To effectively monitor and control these processes, operators track various key performance indicators (KPIs) related to production, quality, safety, and environmental compliance. Here are some common reporting KPIs that chemical process operators typically track:
-
Production Rate: The production rate measures the quantity of product manufactured per unit of time (e.g., kilograms per hour or barrels per day). Monitoring production rates helps operators ensure that production targets are being met and identify any deviations that may indicate equipment malfunctions or process inefficiencies.
-
Yield: Yield refers to the percentage of raw materials that are converted into usable products during the manufacturing process. Tracking yield helps operators assess the efficiency of the production process and identify opportunities for optimization or waste reduction.
-
Quality Metrics: Quality metrics include parameters such as product purity, composition, viscosity, pH, color, and other physical or chemical properties. Operators monitor these metrics to ensure that the final product meets the required specifications and quality standards.
-
Energy Consumption: Energy consumption KPIs track the amount of energy (e.g., electricity, steam, natural gas) used during the production process. Monitoring energy consumption helps operators identify opportunities for energy conservation and cost reduction while ensuring that production remains environmentally sustainable.
-
Material Losses/Waste: Operators track material losses and waste generated during the manufacturing process, including raw material losses, by-products, and off-spec products. Minimizing material losses and waste helps improve overall process efficiency and reduce production costs.
-
Equipment Downtime: Equipment downtime refers to the amount of time that production equipment is not operational due to maintenance, repairs, or unplanned shutdowns. Minimizing downtime is critical for maximizing production throughput and maintaining consistent product supply.
-
Safety Incidents: Safety incidents include accidents, injuries, spills, leaks, and other safety-related events that occur during the manufacturing process. Operators track safety incidents to identify potential hazards, implement corrective actions, and prevent future incidents.
-
Environmental Compliance: Environmental compliance KPIs measure the facility's adherence to regulatory requirements related to emissions, effluent discharge, waste disposal, and other environmental parameters. Operators monitor these KPIs to ensure that the facility operates within legal limits and maintains a good environmental stewardship.
-
Process Efficiency: Process efficiency KPIs, such as overall equipment effectiveness (OEE) or specific equipment utilization rates, quantify the efficiency of individual process units or the entire manufacturing process. Improving process efficiency helps optimize resource utilization, reduce production costs, and enhance competitiveness.
-
Process Stability: Process stability metrics assess the variability and consistency of key process parameters over time. Stable processes are predictable and produce consistent results, while unstable processes may exhibit fluctuations or deviations that indicate underlying issues requiring attention.


