InetSoft Product Information: Option for an SAP BI Dashboard
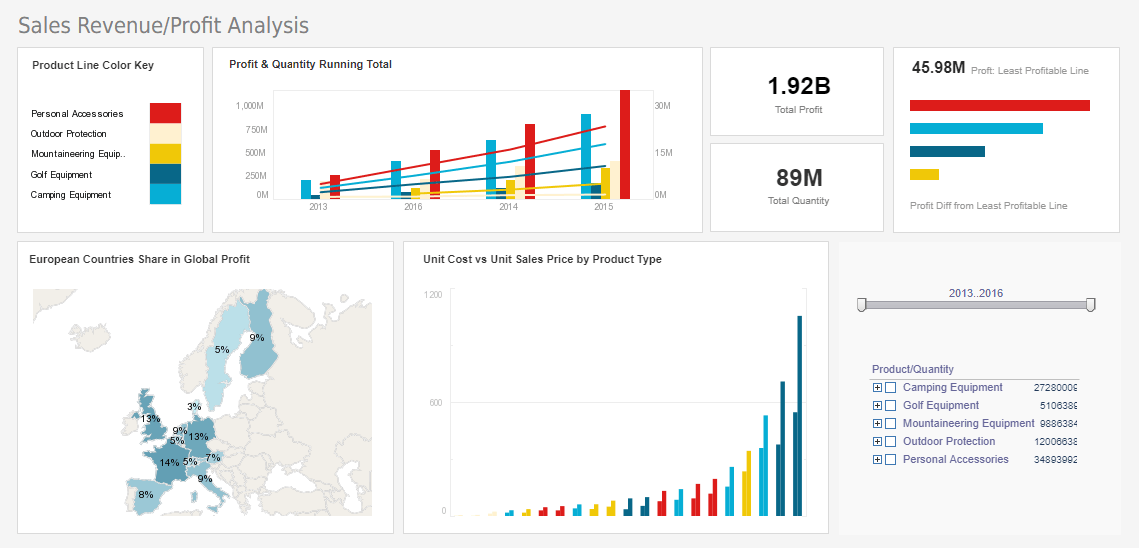
Looking for an SAP BI dashboard? InetSoft offers an option with its Web-based dashboard application that has a connector to SAP and can mashup up data from almost any other data source. View a demo.
Dashboard and Balanced Scorecard - Being able to create a balanced scorecard is a feature not found in all dashboard software. InetSoft's dashboard software permits you to create balanced scorecards that are color-coded for variances above or below targets and have no limit to the kind of key performance indicators you can create and track on the scorecard. InetSoft offers Dashboard Scorecard Software that is robust enough to: * attract the attention of executives * satisfy the demands of power users * adapt to organizations of all sizes and is easy enough to be: * deployed in a matter of weeks, not months * learned by end-users with minor training...
Dashboard Analytics Provider - Are you looking for a good dashboard analytics provider? Since 1996 InetSoft has been making BI software that is easy to deploy and easy to use. Build self-service oriented dashboards and visual analyses quickly. InetSoft's data mashup engine solves the data access and transformation challenges that other tools cannot. View a 3-minute demo and read customer reviews...
Dashboard Application - InetSoft's dashboard application allows hierarchical arrangement of multidimensional data and produces brilliant visualizations. There are two ways to add additional hierarchy levels to a Selection Tree. The following sections explain both methods. To add levels to an existing Selection Tree hierarchy, follow these steps: 1. Expand a Data Block (table) or cube dimension in the Component tree. 2. Ctrl-click or Shift-click to select one or more columns in the Data Block or one or more levels in the cube dimension. 3. Drag the selected columns or levels onto an existing Selection Tree that is bound to the same Data Block or cube dimension. (Drop the columns or levels onto the Selection Tree when the green highlight appears.) This adds the selected fields to the bottom (inner-most levels) of the Selection Tree hierarchy. The nesting order for the new levels is determined by the order in which you selected the fields in the Component tree...
Dashboard Application Components - InetSoft's dashboard application components are deeply rooted in Javascript making them sturdy, powerful, and easy to deploy. A Selection Container can hold Selection List and Range Slider components. To add selection components to a Selection Container, follow the steps below: 1. Drag a Selection Container component from the Component tree onto the Viewsheet grid. This creates an empty Selection Container element. 2. Drag a data field onto the Selection Container. (Use the green highlight to place the field as desired.) You can obtain this field from two sources: a. Drag a field from the Data Block in the Component tree onto the Selection Container. b. Drag a field from the Chart Editor onto the Selection Container. This adds the chosen field to the Selection Container as a Selection List (categorical field) or a Range Slider(numerical or date field). 3. (Optional) Right-click on the Selection Container, and select 'Properties' from the context menu. This opens the 'Selection Container Properties' dialog box. 4. (Optional) To permit the end-user to drag new fields from the Chart Editor to the Selection Container, enable 'Allow New Selections in Viewer'...
Dashboard Application Download - Are you looking to download a dashboard application? Since 1996 InetSoft has been making dashboard software that is easy to deploy and easy to use. Build self-service oriented dashboards quickly . View a demo and download a free version...
Dashboard Application for Business Intelligence - InetSoft's software for business intelligence dashboards is 100% Java code at the server level and HTML, JavaScript, and HTML5 at the client level, which combined with its SOA architecture and open standards-based technology, makes for an ideal embedding and integration-ready tool for dashboards, scorecards, and reporting in jsp pages. End-users get visually compelling, highly interactive access to data, and solution providers get a highly customizable, quick to learn and quick to deploy dashboard tools, templates, and information delivery platform...
Dashboard Application for Live Data - Looking for dashboard application for live data? InetSoft is a pioneer in self-service dashboarding and makes it easy to create real-time dashboards with a drag and drop designer. View a demo and try interactive examples...

