Evaluate InetSoft's SharePoint Graphical Reporting Tool
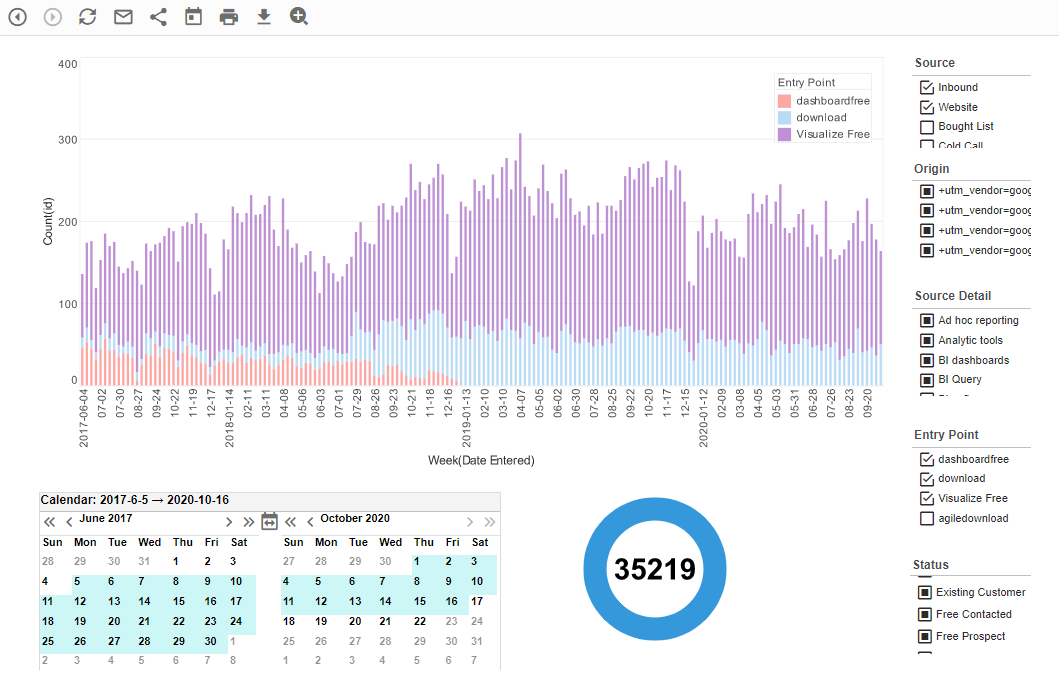
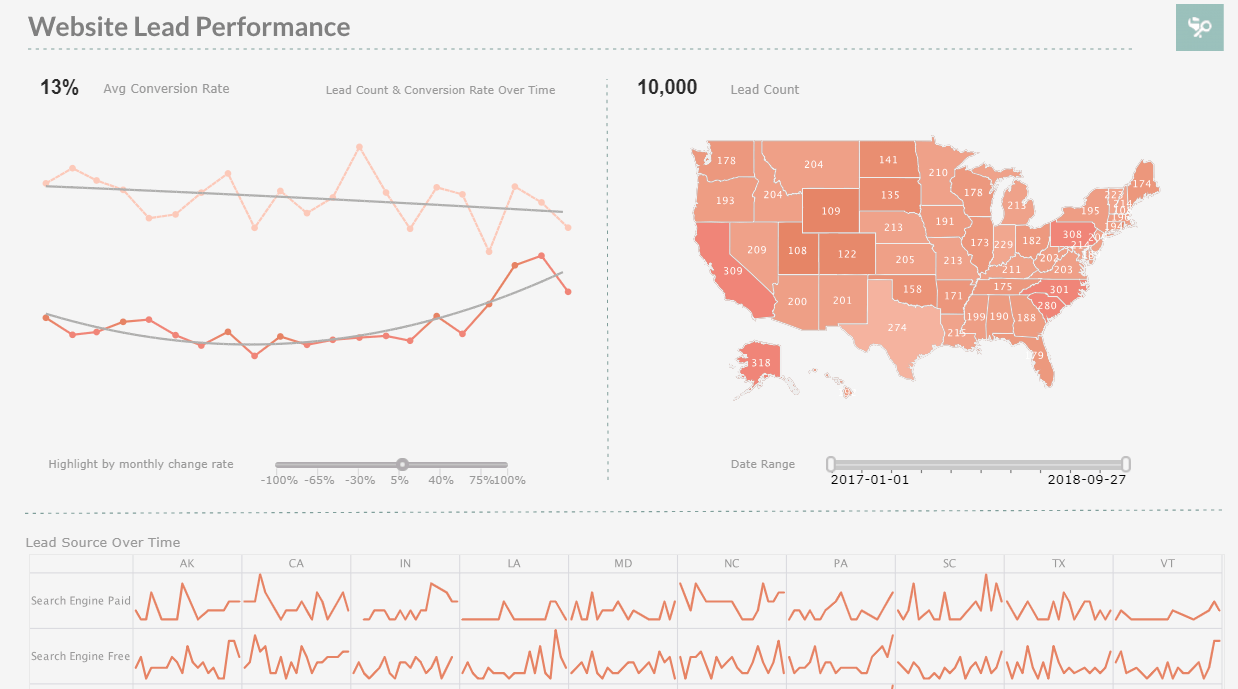
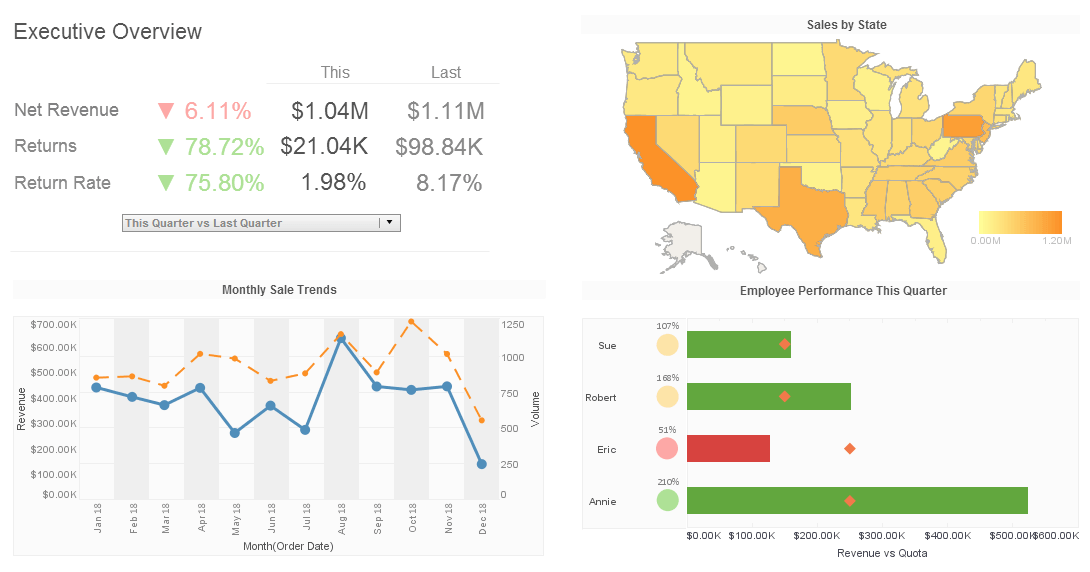
Are you looking for a good SharePoint graphical reporting for your team? InetSoft's pioneering BI application produces great-looking cloud-based dashboards with an easy-to-use drag-and-drop designer. Maximize self-service for business and technical staff. View a demo and try interactive examples.

Register for more information and a personalized demo
About InetSoft
Since 1996 InetSoft has been delivering easy, agile, and robust business intelligence software that makes it possible for organizations and solution providers of all sizes to deploy or embed full-featured business intelligence solutions. Application highlights include visually-compelling and interactive dashboards that ensure greater end-user adoption plus pixel-perfect report generation, scheduling, and bursting. InetSoft's patent pending Data Block™ technology enables productive reuse of queries and a unique capability for end-user defined data mashup.
This capability combined with efficient information access enabled by InetSoft's visual analysis technologies allows maximum self-service that benefits the average business user, the IT administrator, and the developer. InetSoft was rated #1 in Butler Analytics Business Analytics Yearbook, and InetSoft's BI solutions have been deployed at over 5,000 organizations worldwide, including 25% of Fortune 500 companies, spanning all types of industries.

What Report Metrics Are Tracked for Community Development Initiatives?
Community development initiatives aim to improve the quality of life, economic opportunities, and social well-being of residents within a community. Tracking and measuring the impact of these initiatives is crucial for assessing effectiveness, allocating resources, and guiding future efforts. Here are some common report metrics that are tracked for community development initiatives:
- Economic Development Metrics:
- Job Creation: Tracking the number of new jobs created through economic development projects, business expansions, and workforce development programs.
- Business Growth: Monitoring the number of new businesses established, business retention rates, and growth in sales revenue.
- Investment Attraction: Tracking private and public investments attracted to the community, including capital investment, grants, loans, and tax incentives.
- Housing and Neighborhood Development Metrics:
- Affordable Housing Units: Monitoring the production and preservation of affordable housing units to address housing affordability challenges.
- Homeownership Rates: Tracking changes in homeownership rates and homeownership assistance programs to promote homeownership opportunities.
- Neighborhood Revitalization: Assessing the impact of neighborhood revitalization efforts on property values, crime rates, infrastructure improvements, and community pride.
- Community Infrastructure Metrics:
- Infrastructure Investments: Tracking investments in infrastructure projects, including roads, bridges, parks, public facilities, utilities, and transportation systems.
- Access to Services: Monitoring access to essential services such as healthcare, education, childcare, libraries, and public transportation.
- Digital Inclusion: Assessing access to broadband internet and digital literacy programs to bridge the digital divide and promote digital inclusion.
- Social Services and Human Development Metrics:
- Education Attainment: Tracking educational attainment levels, graduation rates, and participation in educational enrichment programs.
- Healthcare Access: Monitoring access to healthcare services, health outcomes, and participation in healthcare programs and initiatives.
- Social Services Utilization: Assessing utilization rates of social services such as food assistance, housing assistance, childcare subsidies, and mental health services.
- Community Engagement and Participation Metrics:
- Civic Engagement: Tracking participation rates in community meetings, public forums, volunteer activities, and civic organizations.
- Resident Satisfaction: Conducting resident surveys to gauge satisfaction with community services, amenities, and quality of life factors.
- Community Cohesion: Assessing levels of social cohesion, trust, and collaboration among residents, organizations, and institutions within the community.
- Environmental Sustainability Metrics:
- Environmental Quality: Monitoring air and water quality, waste management practices, and environmental conservation efforts.
- Green Spaces and Recreation: Tracking access to parks, green spaces, recreational facilities, and outdoor amenities to promote health and well-being.
- Sustainable Development Practices: Assessing the adoption of sustainable development practices such as energy efficiency, renewable energy, green building, and smart growth principles.
- Small Business and Entrepreneurship Metrics:
- Small Business Support: Tracking support services and resources provided to small businesses and entrepreneurs, including technical assistance, financing, and mentorship programs.
- Business Success Rates: Monitoring business survival rates, growth trajectories, and job creation potential of small businesses and startups.
- Entrepreneurial Ecosystem: Assessing the strength and vibrancy of the local entrepreneurial ecosystem, including incubators, accelerators, co-working spaces, and networking events.
| #1 Ranking: Read how InetSoft was rated #1 for user adoption in G2's user survey-based index | Read More |
More Resources and Articles about InetSoft's SharePoint Graphical Reporting Tool
BI Dashboard Tools from InetSoft - When you are shopping for BI dashboard tools there are some automatic concerns you have. Flexibility, power, speed, compatibility all come to the forefront of your mind. A great dashboard generator will have a marriage of tools that address every area of business IT and BI needs. That is what makes InetSoft's BI software so attractive to so many users. Since 1996 InetSoft has been crafting the perfect BI tool that fits the power needs of businesses of any size, with the IT friendliness for beginners...
BI Tools to Integrate with SharePoint - It's no wonder that so many businesses adopt Microsoft SharePoint as a collaboration tool. SharePoint sites provide an easy way for organizations to share information and coordinate on projects and tasks. However, using SharePoint alone as a business intelligence tool has definite limitations...
Chart Generator Product - Looking for a chart generator tool? Since 1996, InetSoft has been providing developers free and commercial reporting and charting tools. View a demo and try them for free. StyleBI is a commercial business intelligence software package with Web-based chart generation, reporting, and real-time access to almost any data source...
Dashboard Reporting System for Legal Firms - Could your law firm use an easy, flexible dashboard reporting system to track performance of its attorneys' productivity? Find the hidden trends, compare milestone performance, and identify top performers. Leading KPIs to track include number of matters opened, hours worked, number of average days billing in lockup, average fee per matter, and ratio of average billed to average worked rate...
Data Binding Summary - Data binding is the process of associating a set of data, usually a data model or the result set of a query, with a report element. Data binding is most commonly used with table, chart, and section elements, but can also be used with text-based elements. Elements can be bound to a data model, a query, or an asset. The data models and queries are created using the Data Modeler, and assets are created using the Data Worksheet...
 |
View live interactive examples in InetSoft's dashboard and visualization gallery. |
Data Intelligence for the Construction Industry - For the construction industry, it has become essential to have large-scale automated data monitoring and report generating functionality incorporated into existing operational systems to manage a multitude of data. Modern construction projects require timely reports to meet project schedules and costs accordingly...
Easy Company Dashboard Reporting - Since 1996 InetSoft has been delivering easy, agile, and robust business intelligence software that makes it possible for organizations and solution providers of all sizes to deploy or embed full-featured business intelligence solutions. InetSoft solutions have been deployed at over 5,000 organizations worldwide, including 25% of Fortune 500 companies, spanning all types of industries...
Element in Data Presentation - The chart is a widely used element in data presentation. It presents data in a graphical form and is very useful to convey implications of certain data in a succinct manner. For instance, a corporate presentation may use a pie chart to show the market share of the industry leaders. This is more easily understood than a table of numbers...
Engine for Business Intelligence - Looking for a flexible and powerful business intelligence engine? InetSoft is a pioneer in dashboard reporting, and our platform includes a data mashup engine for generating complete views of corporate performance. View a demo and try interactive examples...
 |
Read the top 10 reasons for selecting InetSoft as your BI partner. |
Enterprise Data Management Application - Looking for an enterprise data management application that also includes dashboards and reporting? InetSoft offers Web-based BI software that includes a flexible data access engine. No need for a data warehouse with direct access to disparate operational data sources of almost any type. Below are articles about InetSoft's software: Structured and Free-form Queries - Queries are written for specific data access purposes and contain logic beyond the generic data model. Queries typically utilize advanced or proprietary database features. The idea is similar to relational database views, except that queries are normally not generic enough to be created as permanent database objects or views...
Epicor Executive Dashboard Alternative - Looking for better Epicor executive dashboards? InetSoft, a pioneer in self-service oriented dashboard software allows for more personalization and supports data mashups across multiple sources for the broadest view of corporate performance. View a demo and try interactive examples...
Evaluation of Report Tools - When evaluating report tools consider this: InetSoft's reporting software is easy, secure, and provides a sophisticated, real-time reporting tool from any business or operations data source. InetSoft's reporting application meets the needs of anyone searching for ad hoc reporting, J2EE reporting and Web based reporting tools. Reports range from production reports to interactive and ad hoc reports, all produced in a zero-client, Web environment. InetSoft's report tool is equipped to perform advanced exploratory analysis and highly flexible reporting, providing a significant decision-making advantage for all users...
ETL Advantages: Rule Definition vs Coding - The tool itself is used to specify data sources and the rules for extracting and processing that data, and then, it executes the process for you. So it's not really the same thing as programming in a traditional programming sense, where you write procedures and code. Instead, the environment works with a graphical interface where you are specifying rules and possibly using a drag-and-drop interface to show the flows of data in a process...
Read what InetSoft customers and partners have said about their selection of Style Report as their production reporting tool. |
Highly Rated Reporting Tools - Looking for a highly rated reporting tool? Since 1996 InetSoft has been delivering easy, agile, and robust business intelligence software that makes it possible for organizations and solution providers of all sizes to deploy or embed full-featured business intelligence solutions. View a demo and try interactive examples. InetSoft's comprehensive reporting platform can be used to create over 30 chart styles including bar, pie, line, curve, radar, waterfall, speedometer, pareto, candle, stock, stick, and bubble. These charts can be customized to show targets, provide desired x/y-axis formats and intervals, and even to show multiple datasets...
How to Create a Data Visualization - So I am going to create another data visualization. I think I will simplify it a little bit. I will show you something along the way. I drag product type in market. Now we just have the states. I can make it a density plot. And in fact, I can even break it down further, and here is a density plot of all the area codes in this data set. And as you can see, there are some significant outliers, and there are also a lot of them that follow along a linear curve. And actually, if I select the trend line, you can see that that's significant...
How Satisfied Are Business Intelligence Customers? Read about satisfied business intelligence customers and how organizations are using business intelligence solutions. Some provide their managers performance management dashboarding. Others use data mashup technology to combine disparate data sources to provide comprehensive dashboard reporting. All of them leverage InetSoft's business intelligence technology to derive intelligence from their data. Morpace Inc. selected InetSoft's StyleBI to provide the visualization and reporting layer for their customer relationship and transaction survey solutions...
Include a Chart on a Web Page - Want to include a chart on a Web page? InetSoft offers free and commercial software for Web-based charting and graphing. StyleBI Enterprise Edition, is the enterprise and OEM-ready chart software product, Visualize Free is the company's free web-based charting application, and StyleBI Agile Edition is a free downloadable charting product, free for up to two users...
Read what InetSoft customers and partners have said about their selection of Style Scope for their solution for dashboard reporting. |
InetSoft's Graphical Dashboards - These pages pertain to InetSoft's graphical dashboard software: Filtering Dashboard Operators - InetSoft's award-winning dashboard software allows users to filter dashboard operators for a truly custom interactive reporting experience. The table below lists the operators available for use in filtering conditions. Operator description equal to True when the column value identically matches the specified criterion. (String matching is case-insensitive...
Looking for the Top Web Application Reporting Tools - An effective BI solution combines state of the art performance with accessibility. Whether you're a traveling executive or an outsourced employee, you still need access to valuable, real-time information. InetSoft's StyleBI offers web-based reporting tools so that your users can access corporate information regardless of where they are. Having BI accessible via the web is essential in order to measure your KPI's in real-time and make sound decisions. InetSoft's BI platform allows you to interact with dashboards on the web, observing changes in data in real-time...
Mobile Reporting Options - Looking for a BI solution that offers effective mobile reporting? Leaving the office doesn't have to mean leaving behind valuable, up-do-date information. InetSoft's StyleBI offers access to corporate information via a broad array of mobile devices. Executives can easily track KPI's regardless of where they are. Having BI accessible via mobile is essential if you have executives who travel or employees who work out in the field. InetSoft's BI platform allows you to perform the same data explorations and stunning visualizations that can be done on a desktop computer...
Navigation to a Report - Let me start by introducing myself. I am a performance management consultant, and I have been focused on government for more than 10 years. Even though I've been doing this for that long, I still consider myself a federal employee since I was one for almost 15 years. Now let's talk about adding navigation to a report. The business analyst should provide some simple ways to analyze the data, providing mechanisms in the report that allow users to display only the data they want. This means the report can be targeted to the needs of the user...
 |
Learn how InetSoft's data intelligence technology is central to delivering efficient business intelligence. |
One of the Top 10 Dashboard Tools - In the world of business intelligence, what would qualify as a 'top 10' dashboard tool? With so many new dashboard tools and BI solution systems, it can become a headache searching for the right solution for your organization. At InetSoft, we simplify the problem for you, plus more. Since 1996, InetSoft has been transcending BI solutions for organizations of all sizes. By carefully considering a business user's point of view, we incorporate tools that only help maximize your organization's effectiveness...
Lightweight Enterprise Business Intelligence - Robust reporting has been incorporated into enterprise business intelligence suites. "Lightweight" BI and reporting vendors and products have emerged to help customers reduce tools costs and hardware requirements. There are two significant trends in reporting technology and markets: convergence and emergence. Production reporting has converged with enterprise business intelligence suites to form a next-generation business intelligence software application. Concurrently, new "lightweight" BI and reporting software has been emerging...
Perfect Small Business Reporting Software - InetSoft's patent pending Data Block™ technology enables productive reuse of queries and a unique capability for end-user defined data mashup. This capability combined with efficient information access enabled by InetSoft's visual analysis technologies allows maximum self-service that benefits the average business user, the IT administrator, and the developer. InetSoft solutions have been deployed at over 5,000 organizations worldwide, including 25% of Fortune 500 companies, spanning all types of industries...
Powerful Tools for BI Reporting - Searching for better tools for reporting? Do you want to move past static paginated reports? Deliver highly graphical, visually appealing, and interactive views into your data with InetSoft's Web-based visualization-driven reporting software. As an innovator in reporting software since 1996, InetSoft has pioneered this evolution towards visualization-driven reporting, and its award-winning software has been deployed at thousands of organizations worldwide and integrated into dozens of other application providers' solutions serving vertical and horizontal markets of their own...


