Visualization for
analytics, dashboards, and reporting
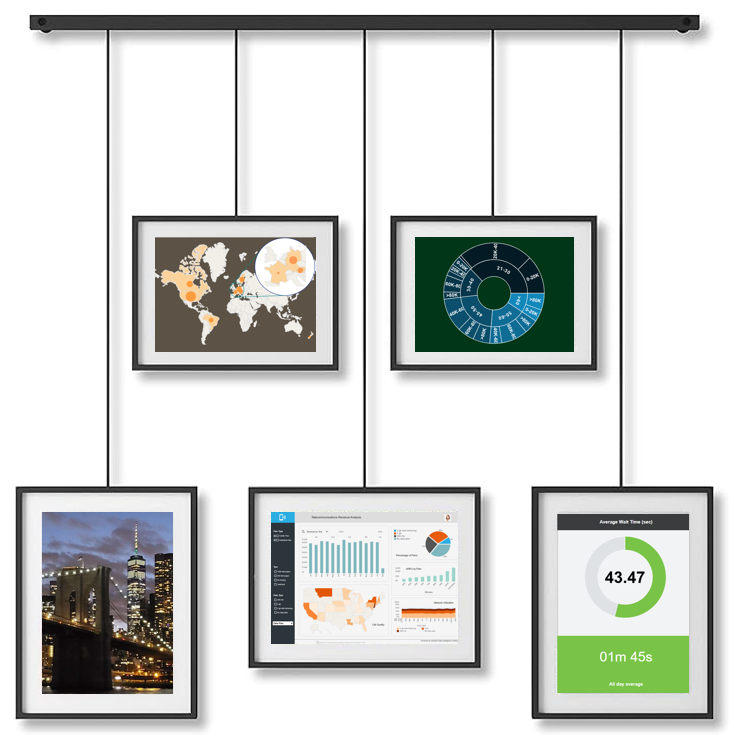
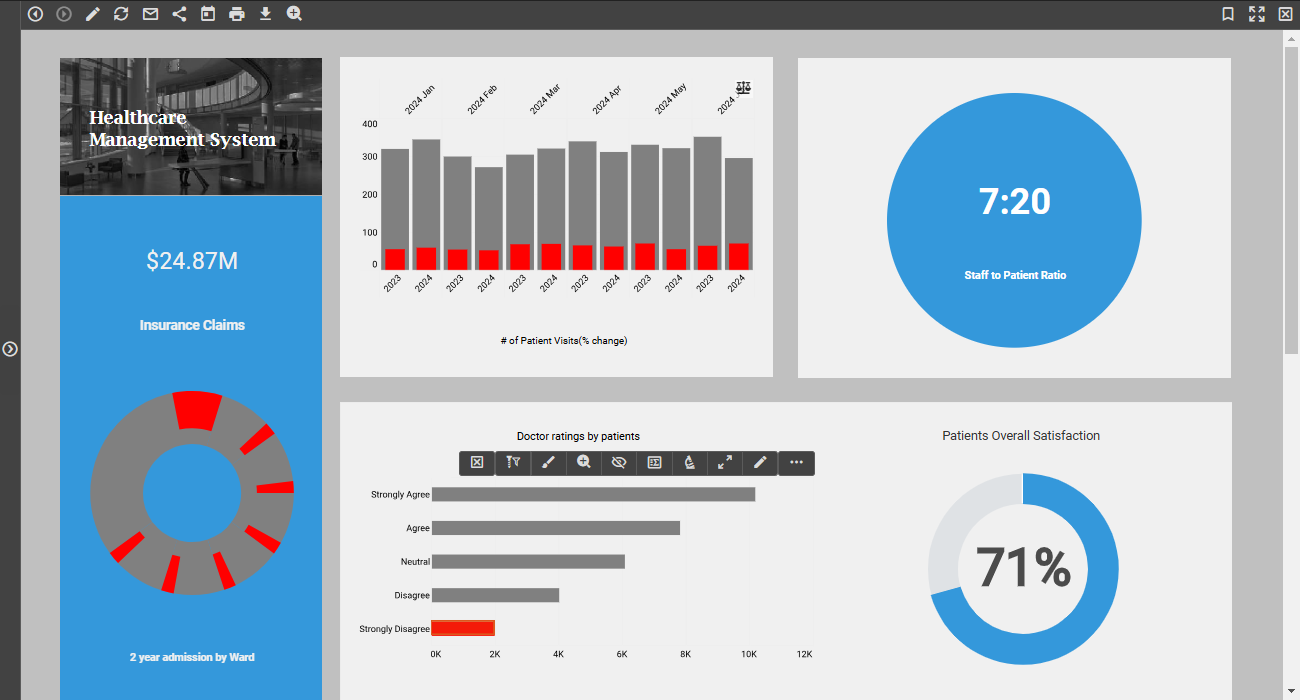
Visualization is a versatile tool for delivering dashboards and reports through both interactive and static media. Designers access it within the web design app, while end users can engage more fully with self-service features.
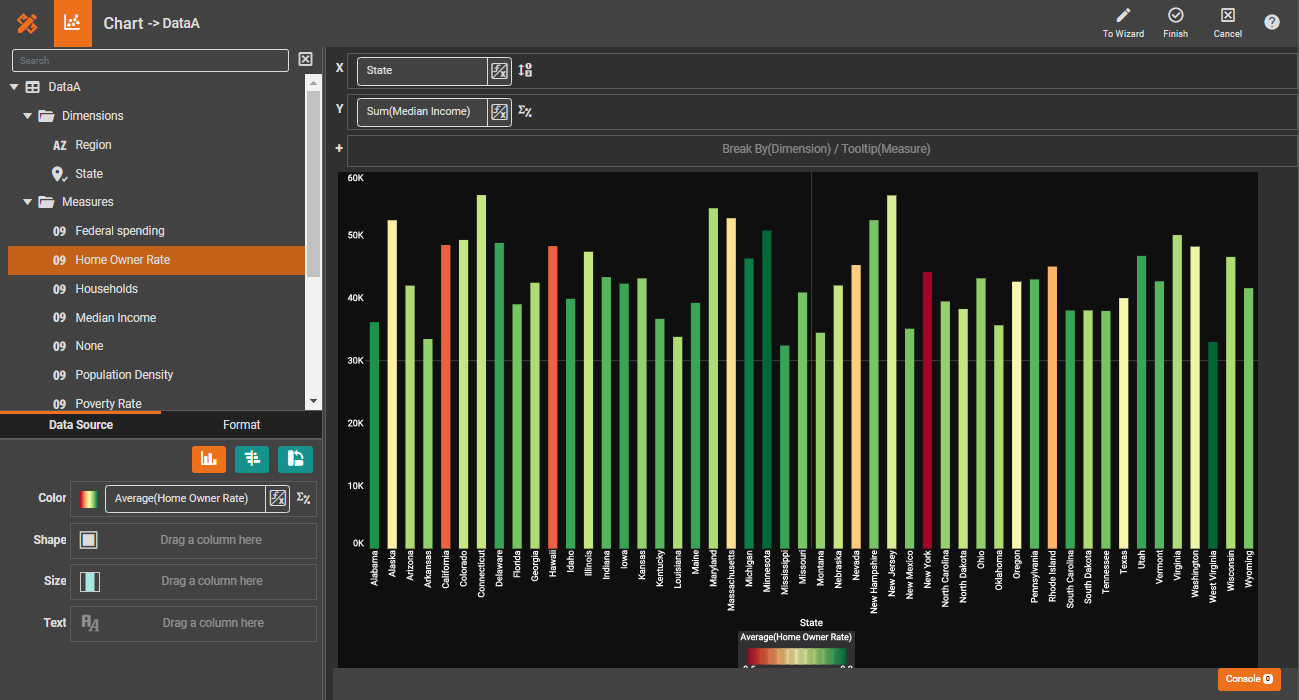
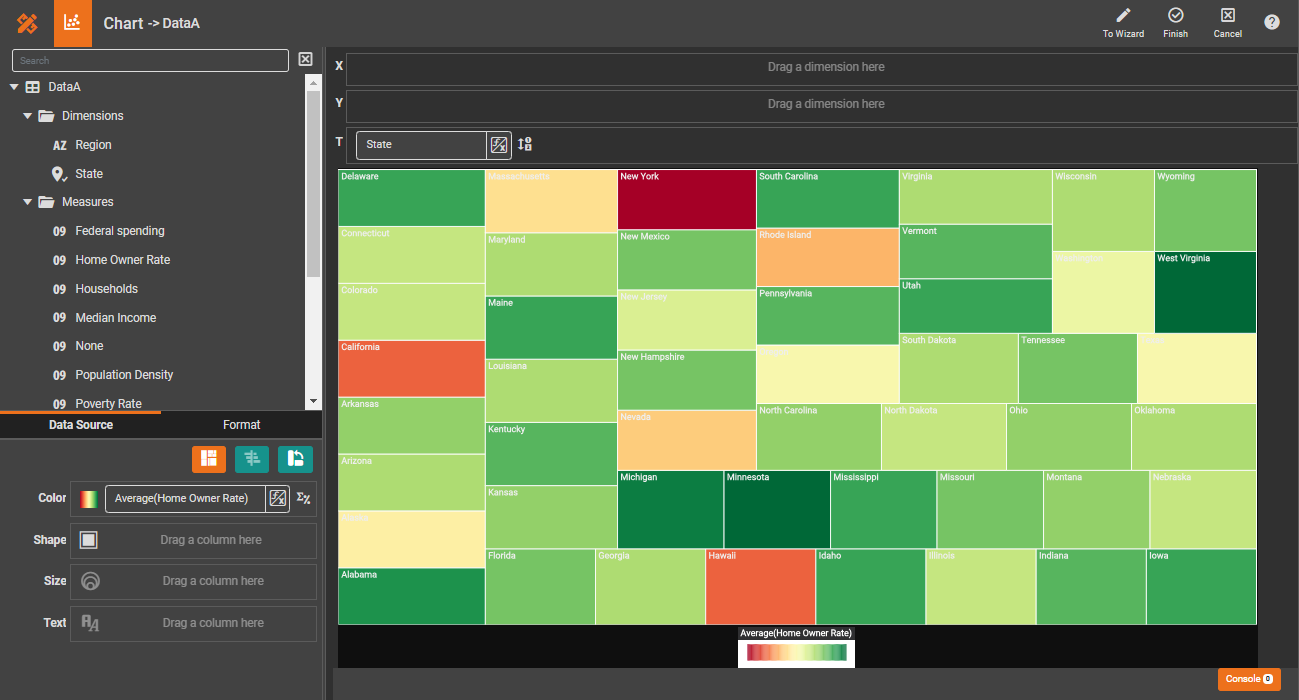
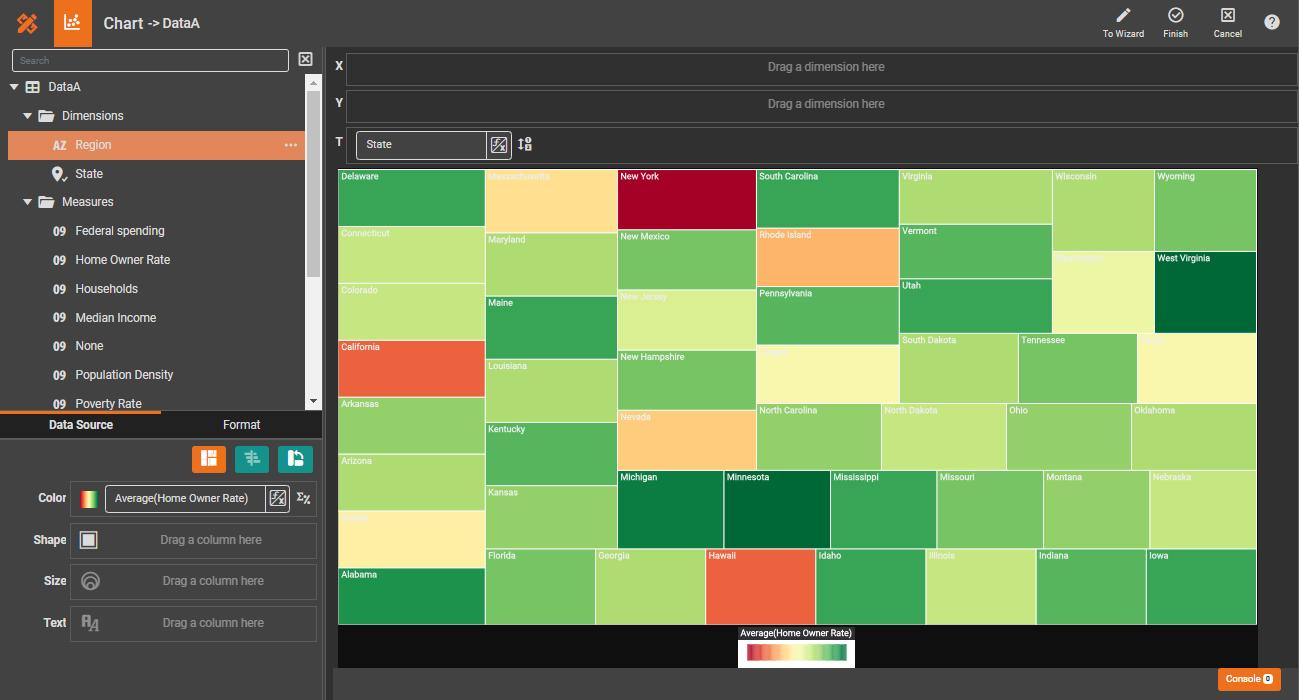
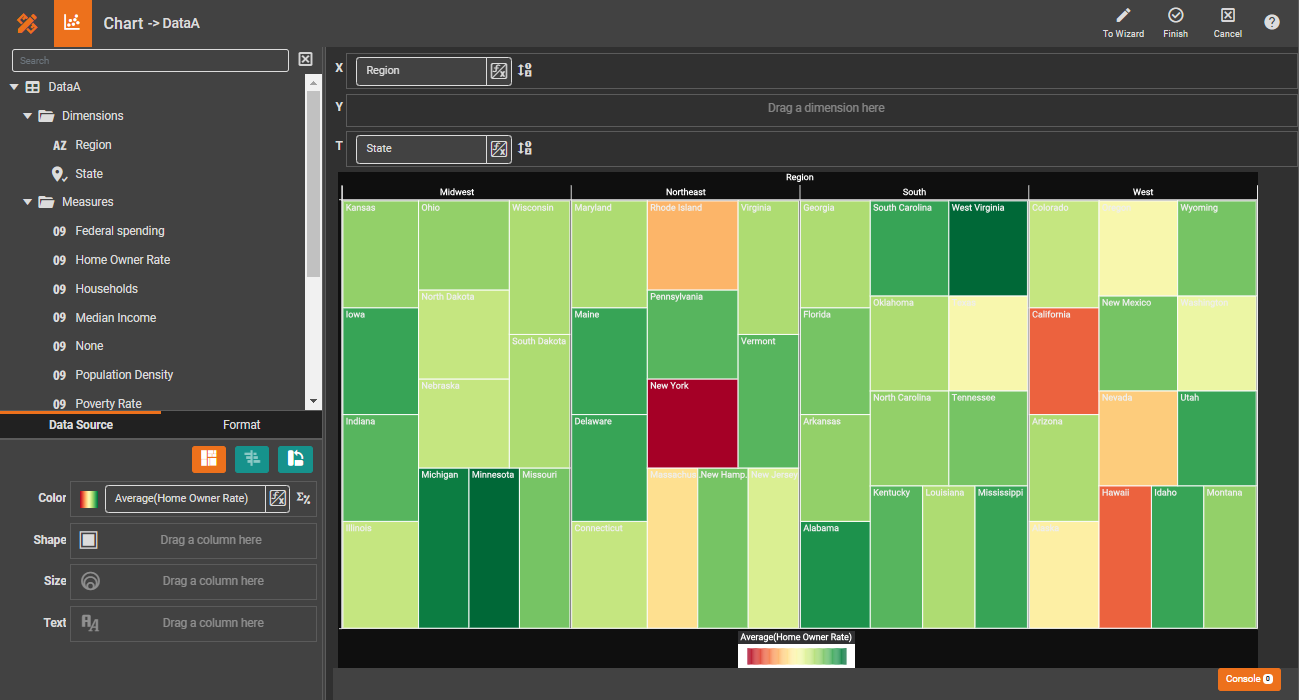
Charting
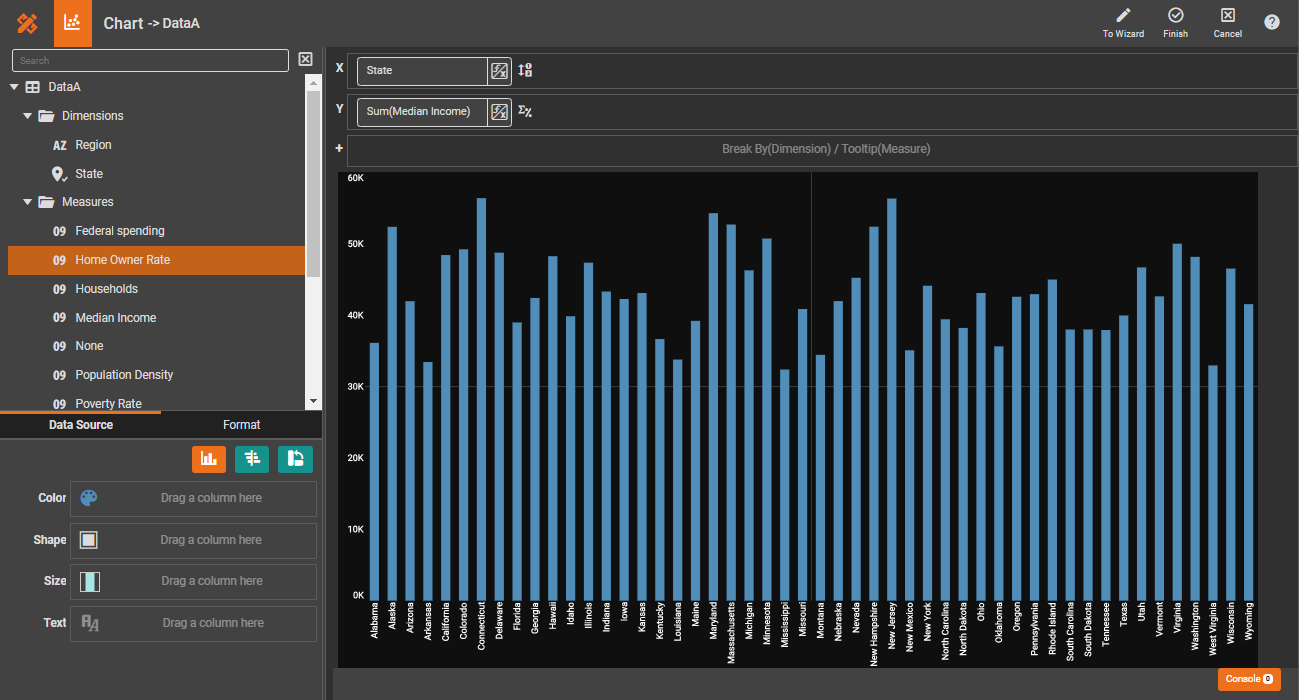
Unleash your creativity with machine-aided chart visualization.
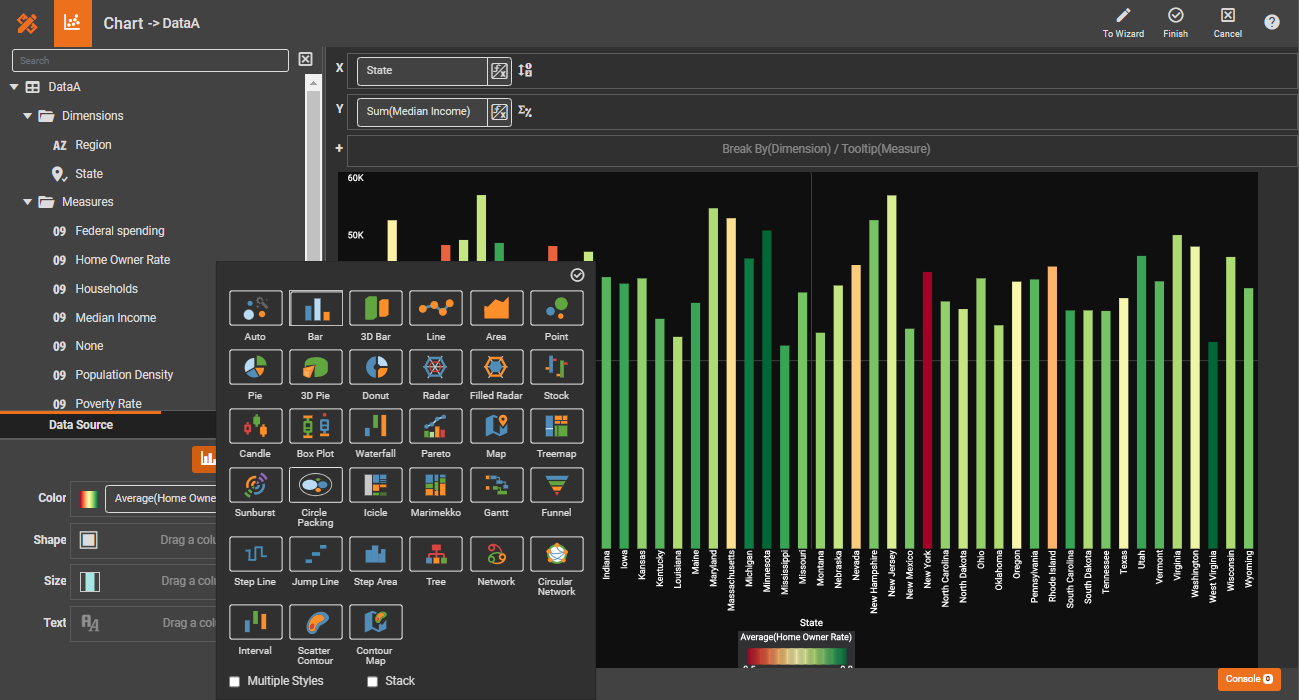
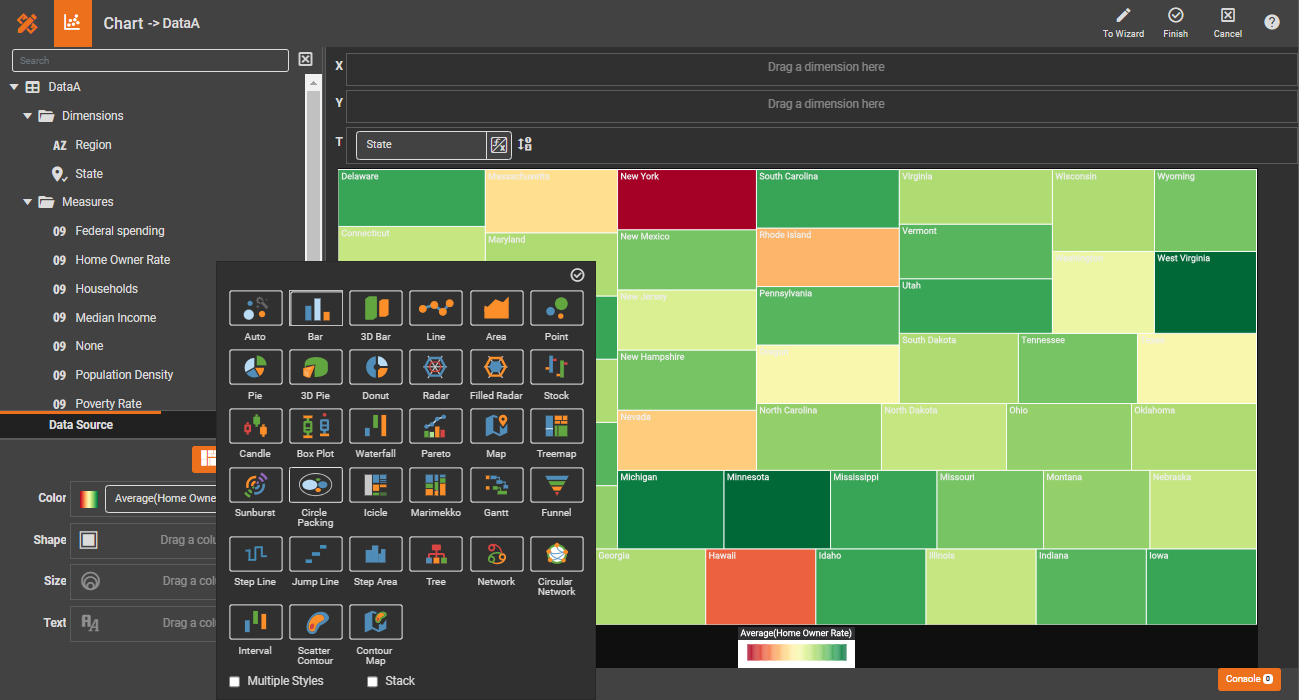
Leverage a rich, extensible chart library.
Built-in chart types address most common business needs, and the library can be easily extended with D3.js charts and your custom chart types.
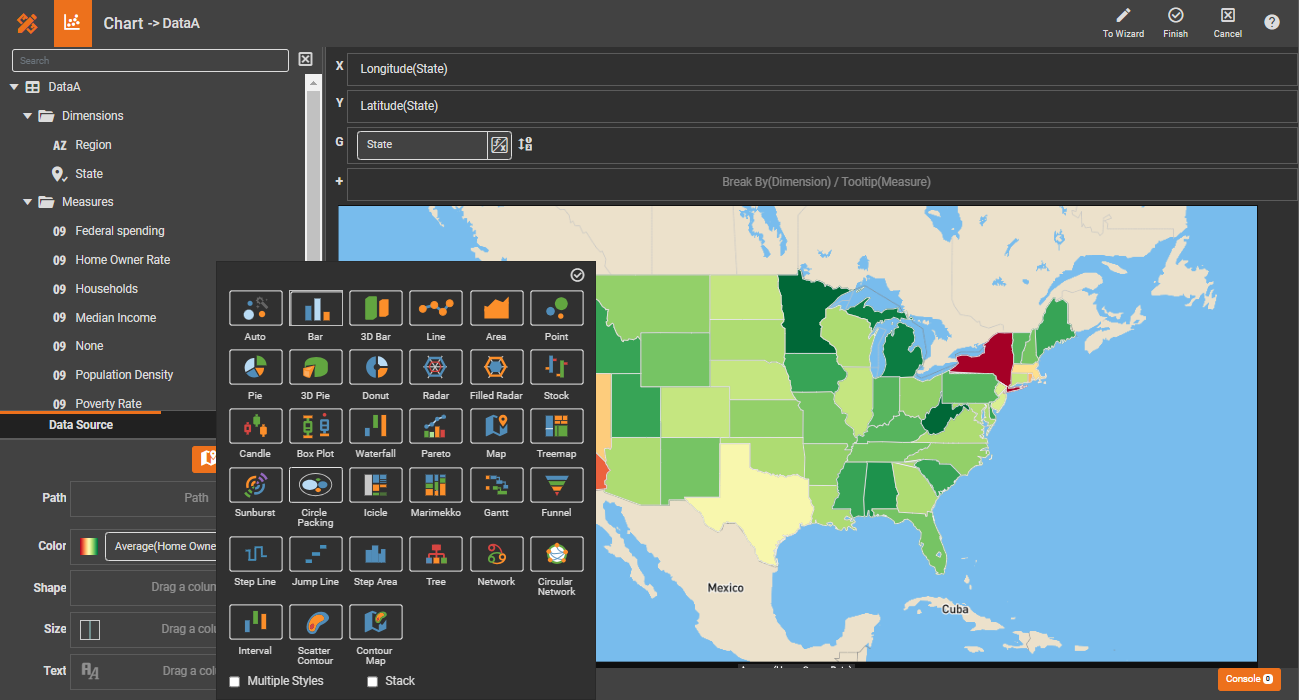
Web maps and shape-based maps
The built-in lightweight shape-based maps offer compact views and extensive customization. Web maps using Google Maps and Mapbox provide comprehensive geo-information.
Embeddable as Web Components
Charts are standard Web Components that can be easily integrated into another application's UI. Just add them as custom elements in your web app.
Extensive scripting API
With a chart scripting API, you can achieve custom chart interactivity and precise chart customization with just a few lines of JavaScript code.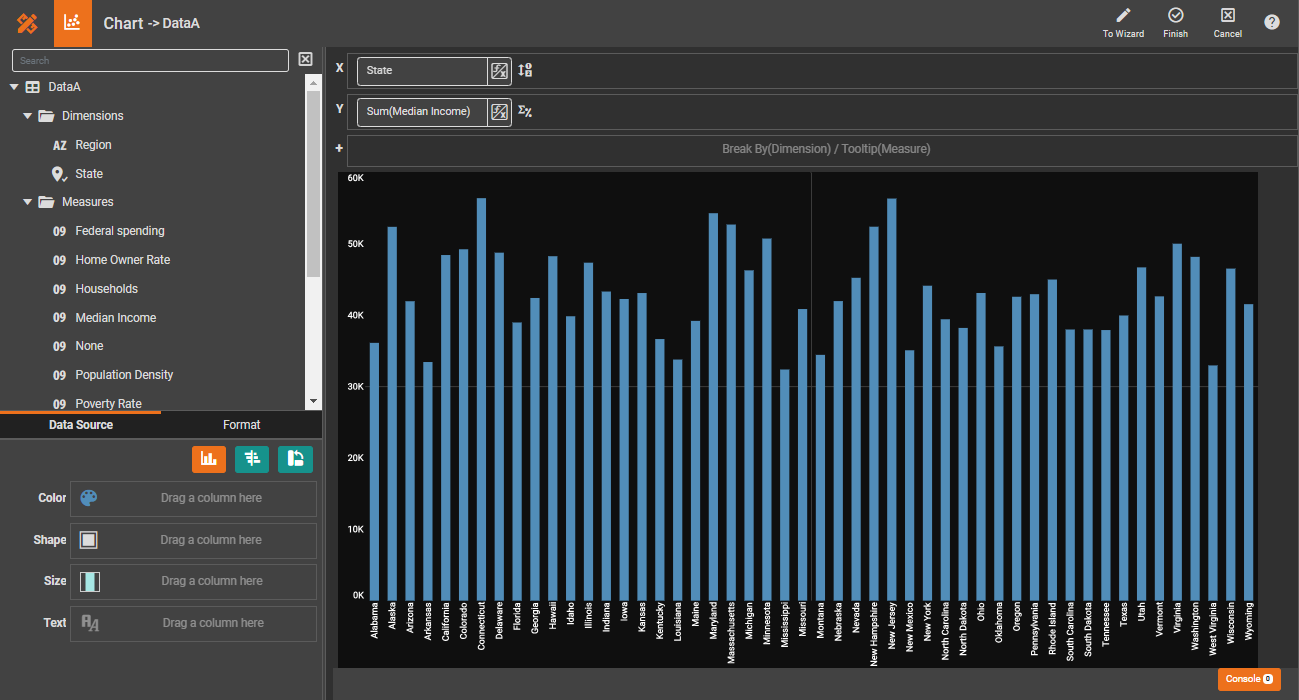


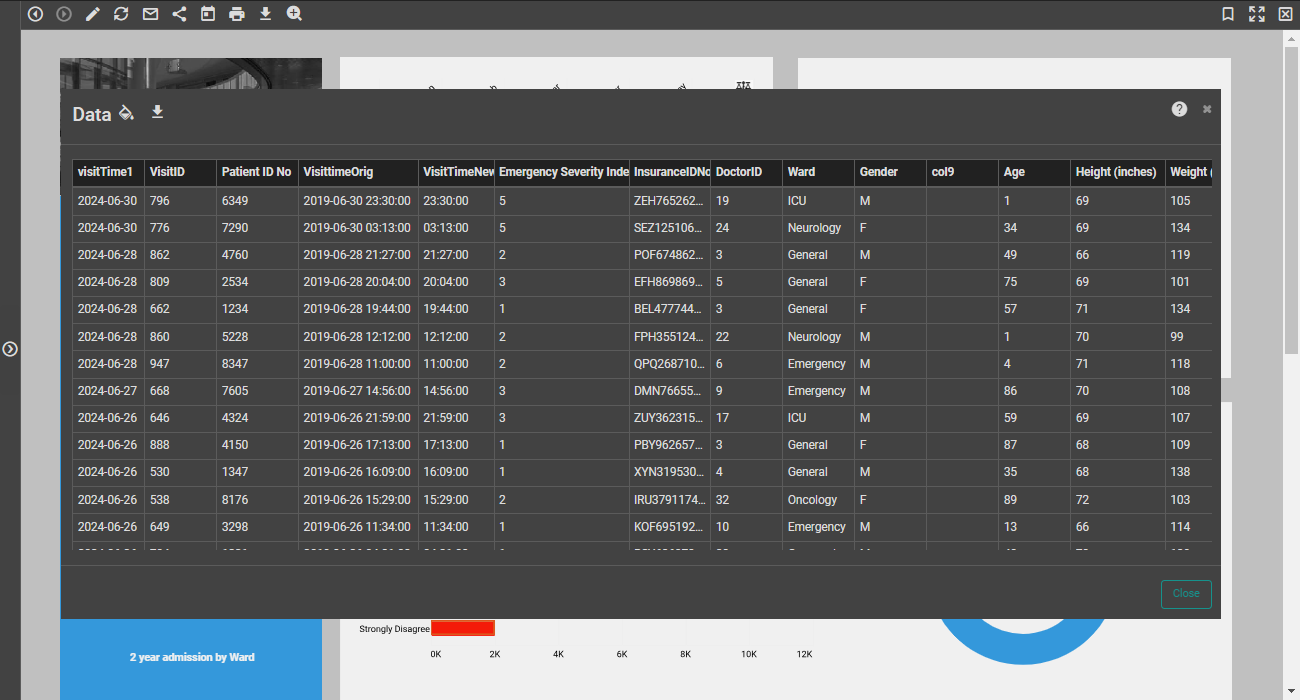
Tabulation
Create Excel-like tables, crosstabs and pivot tables with ease.
Multiple table types
Make simple tables easily and complex tables possible.
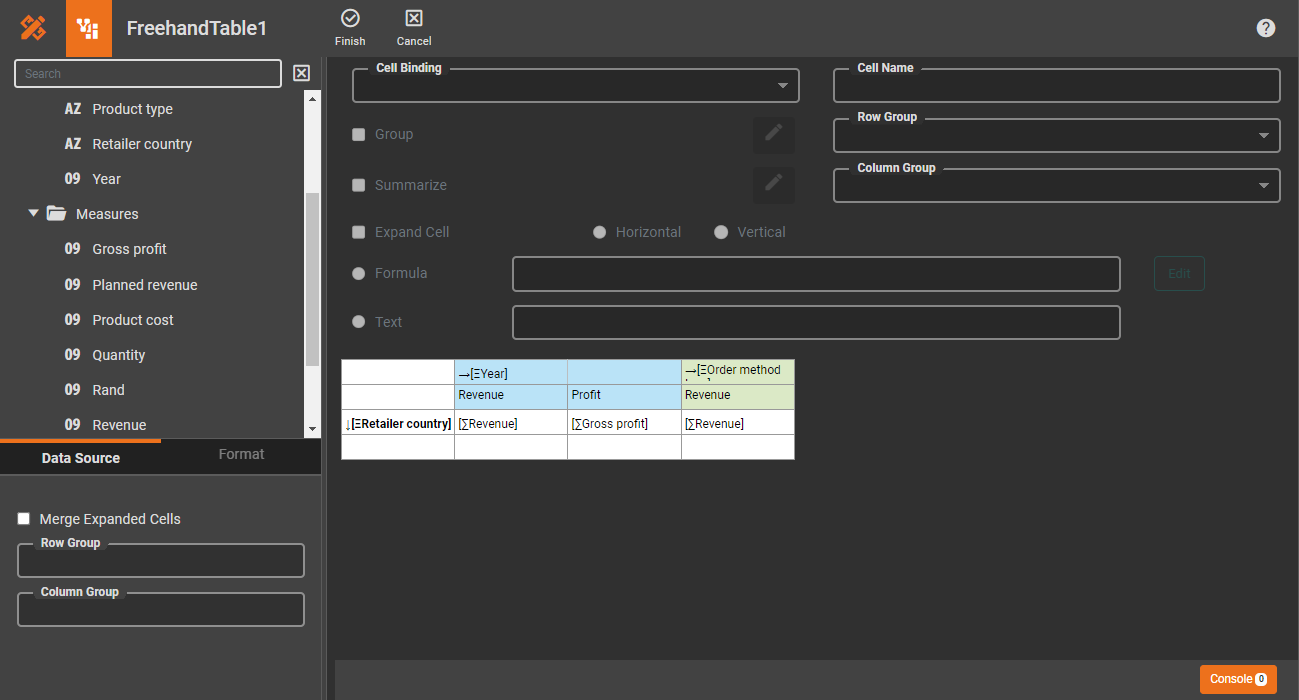
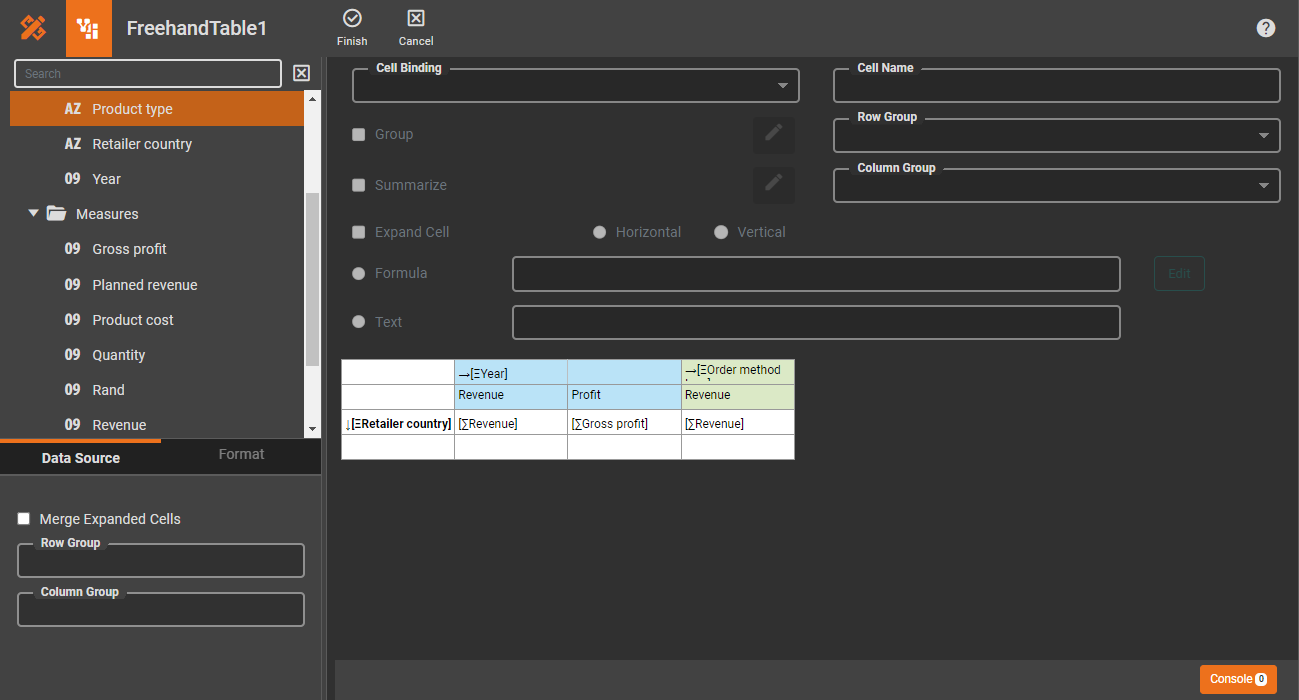
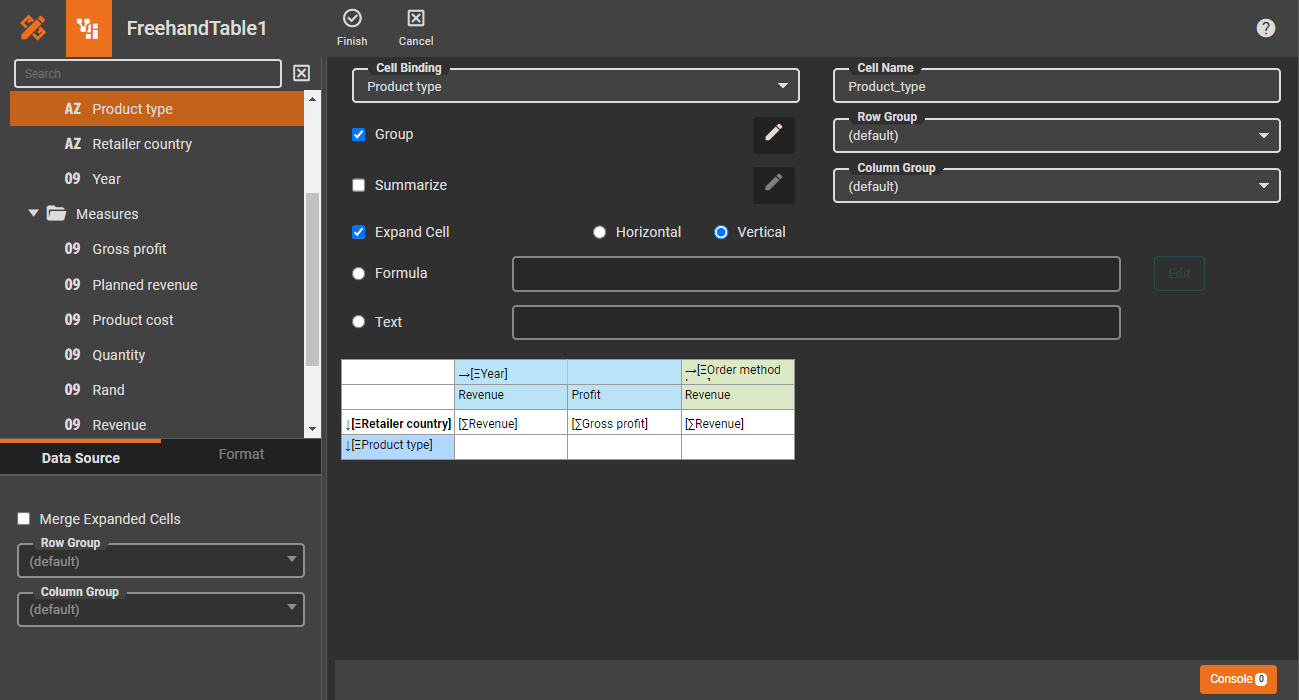
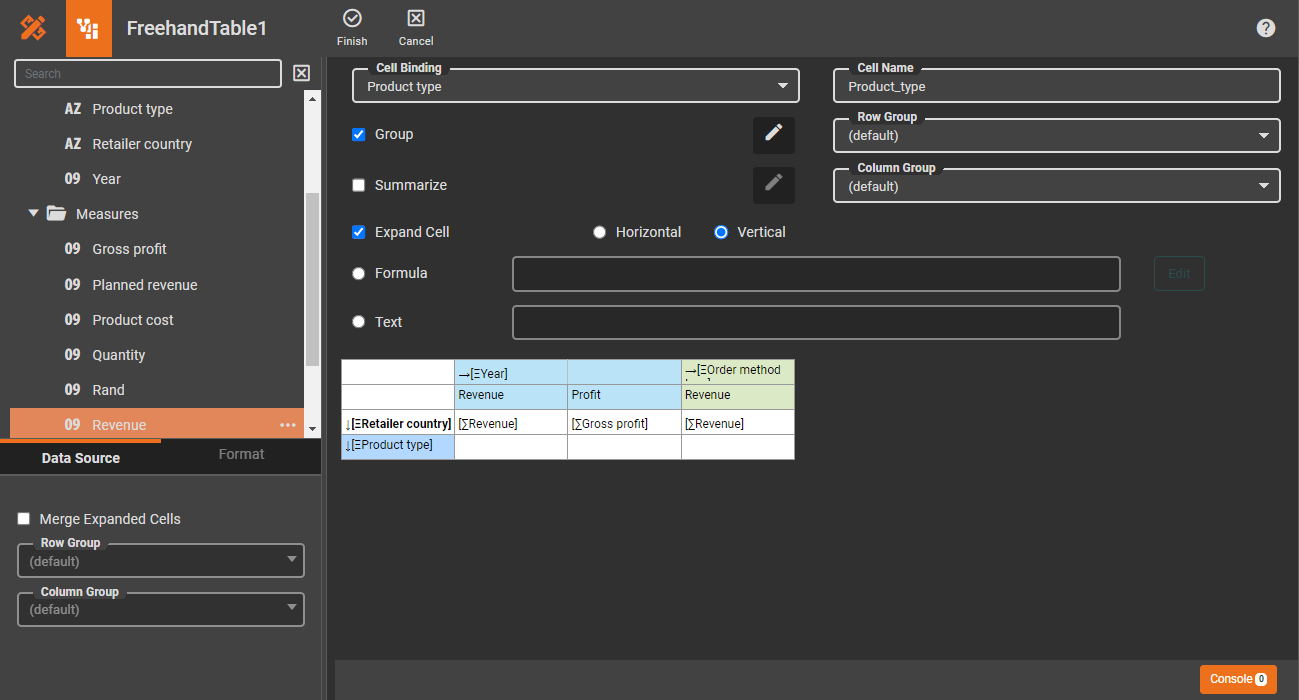
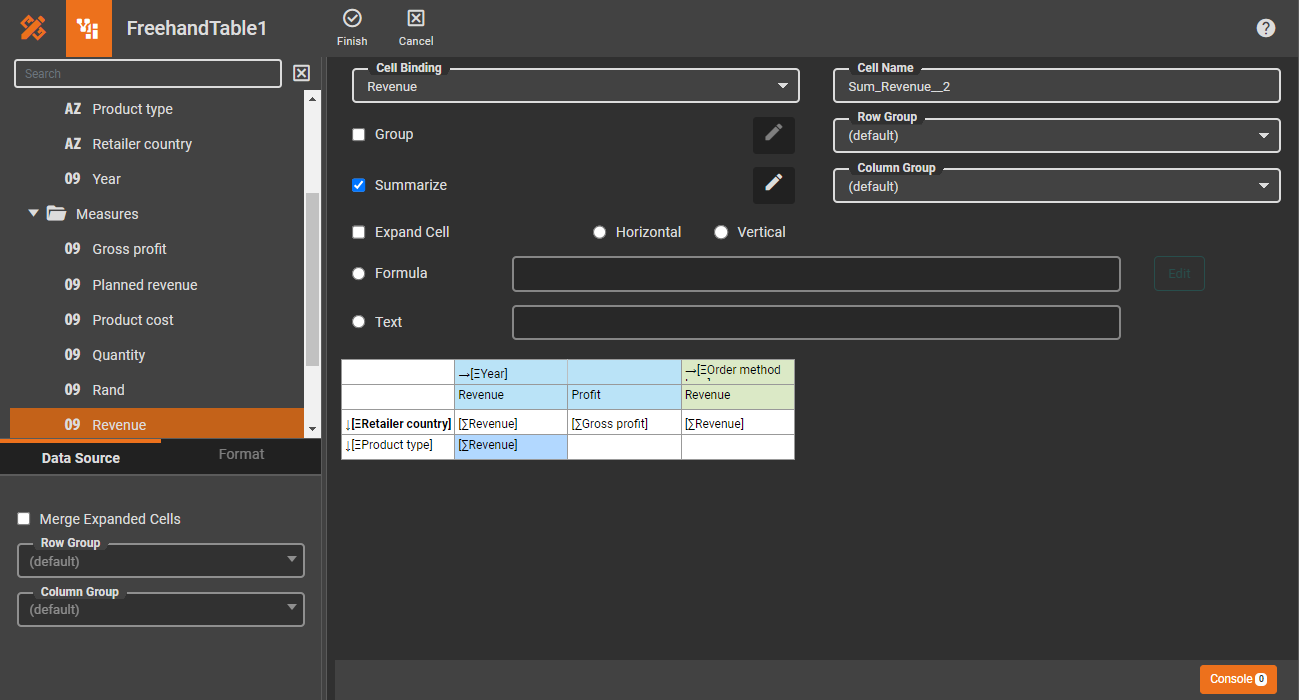
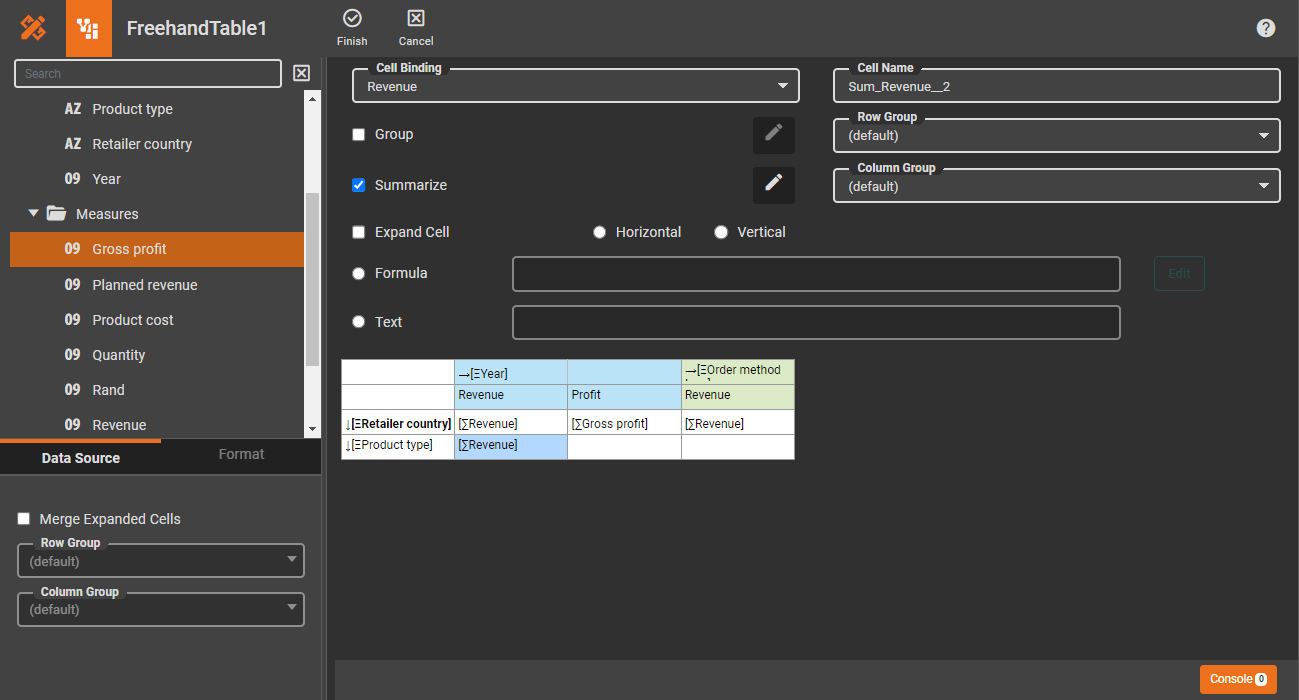
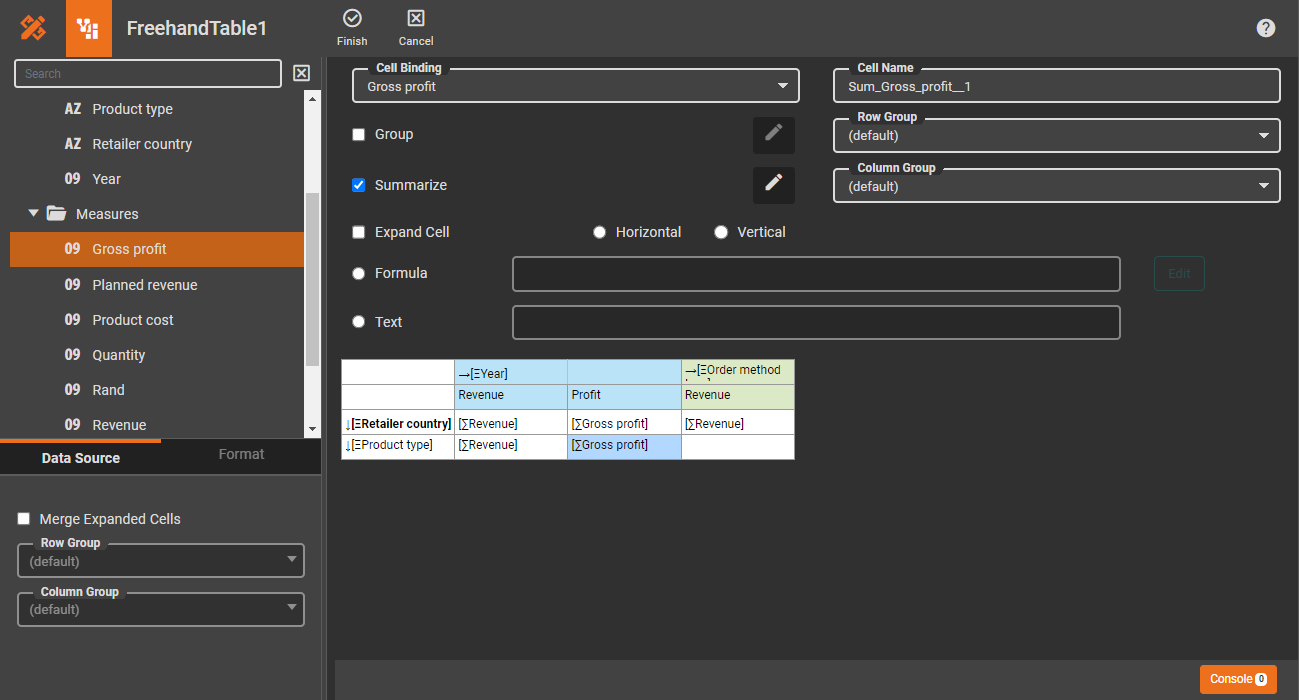
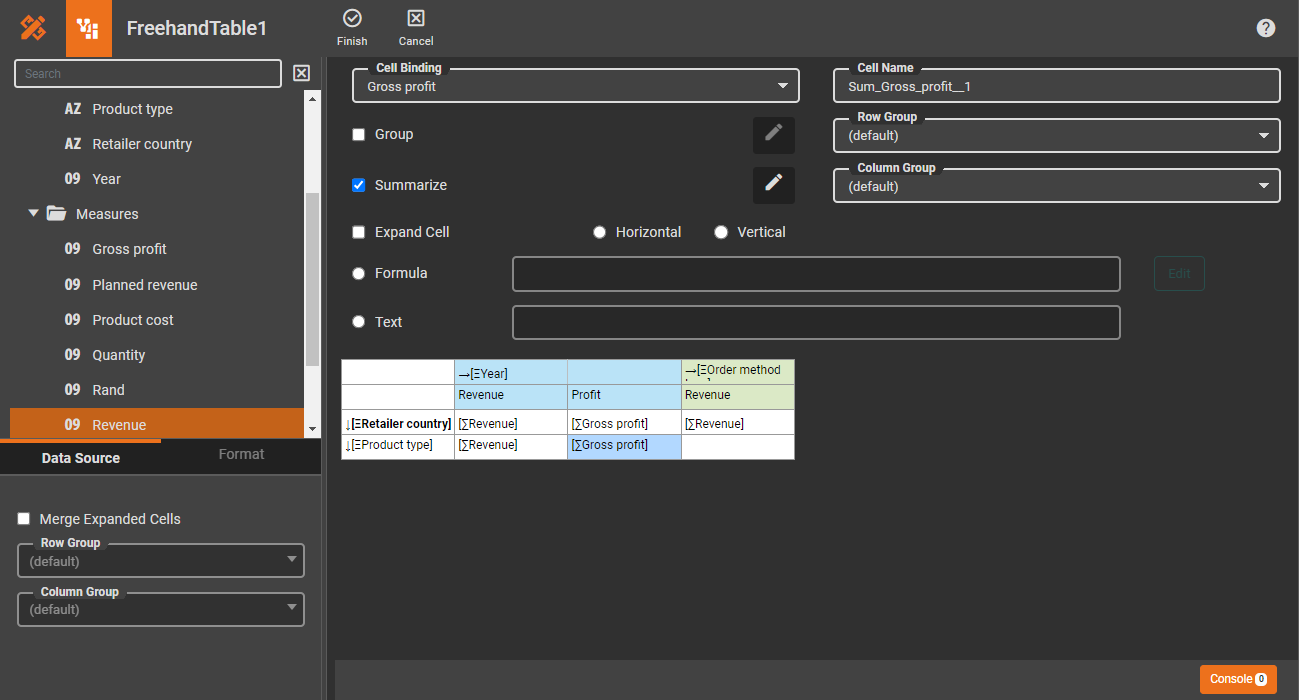
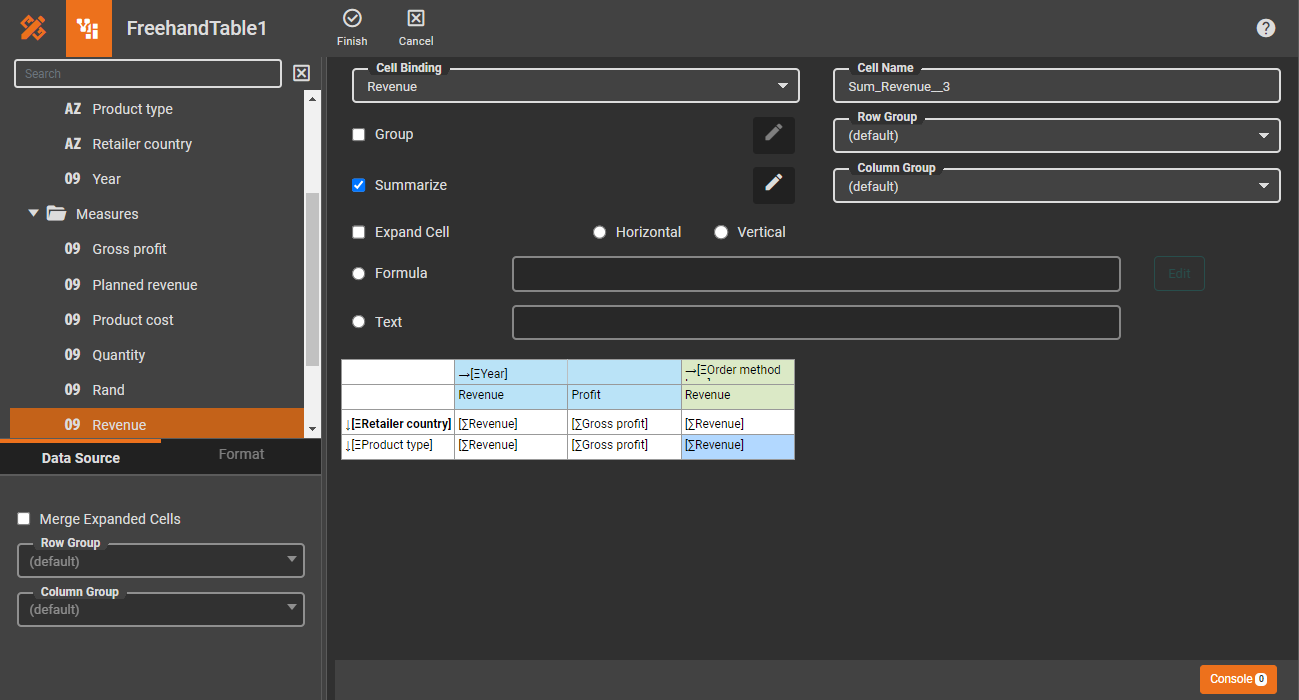
Correlated table grid
With the advanced Freehand Table component, you can create correlated tables and pivot tables in a grid and perform intercell calculations using formulas. Say goodbye to the headaches of creating complex Excel-like reports.
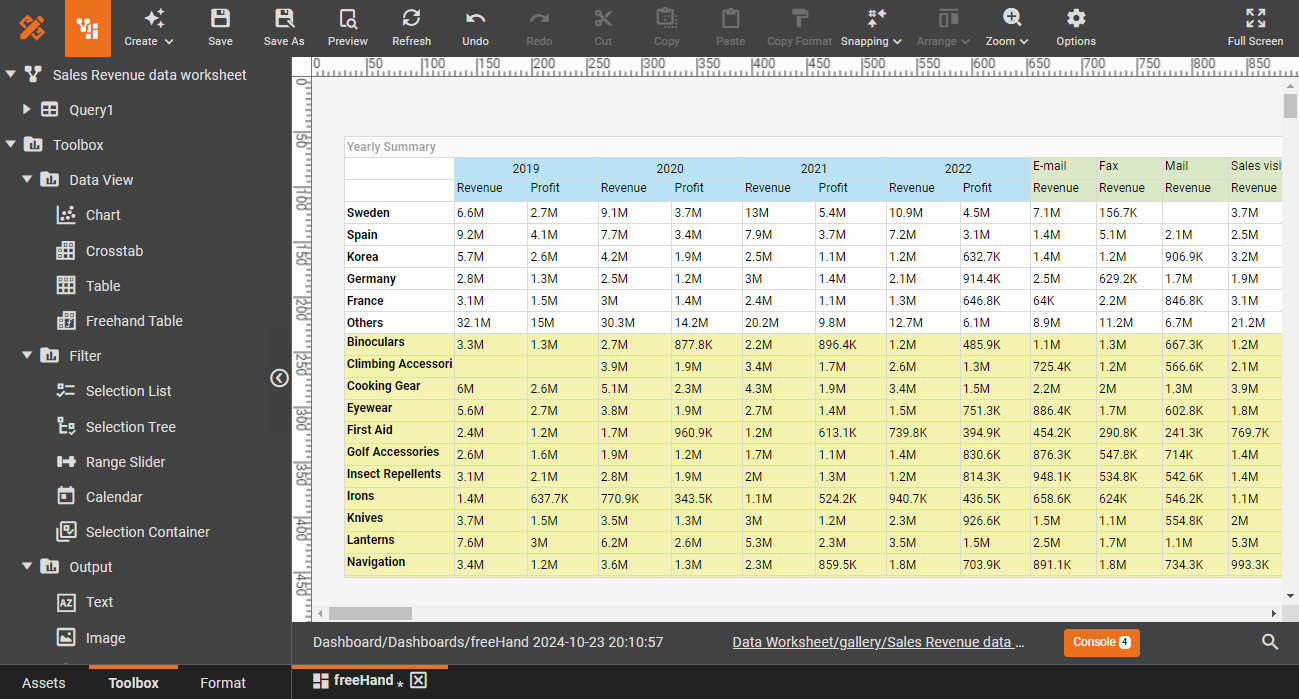
Style tables for readability
Built-in Word-like table styles, including alternating row backgrounds, greatly enhance readability. You can also create your own custom table styles.
Automatic pagination
When a table is delivered in a medium without scrolling capabilities, such as a PDF, pagination is automatically enabled.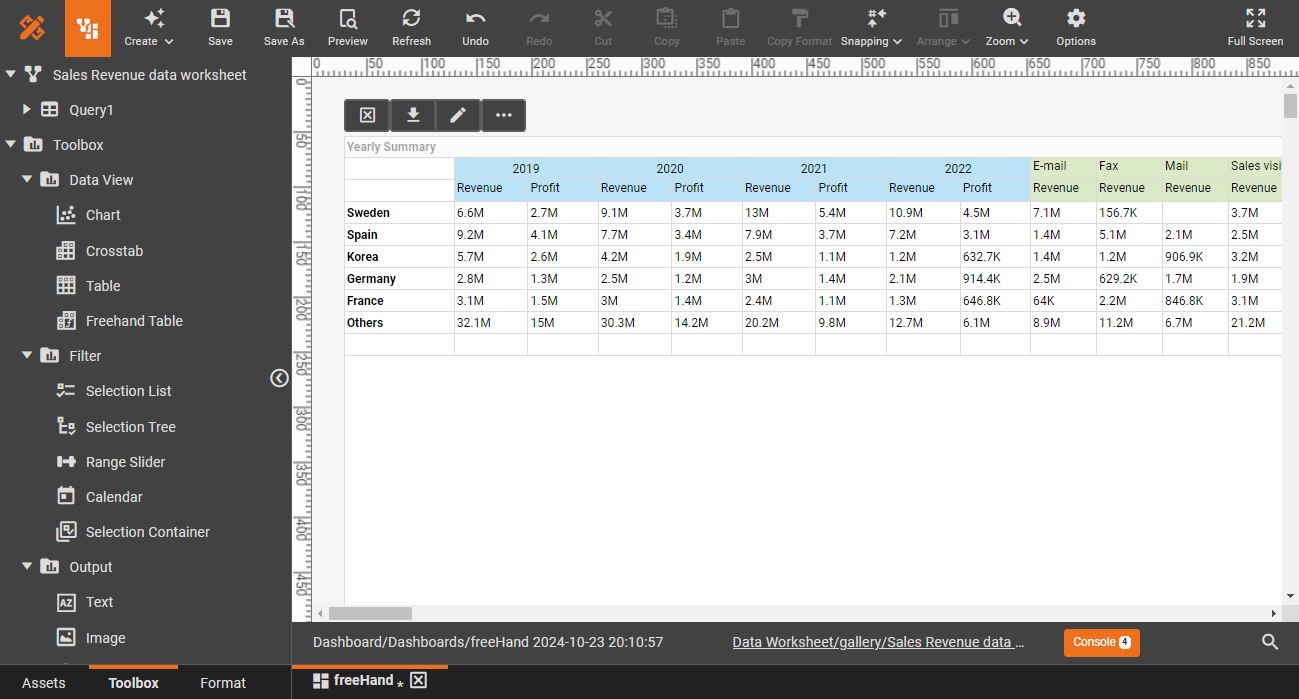

Self-service
Granular self-service controls tailored to users' needs and skills.
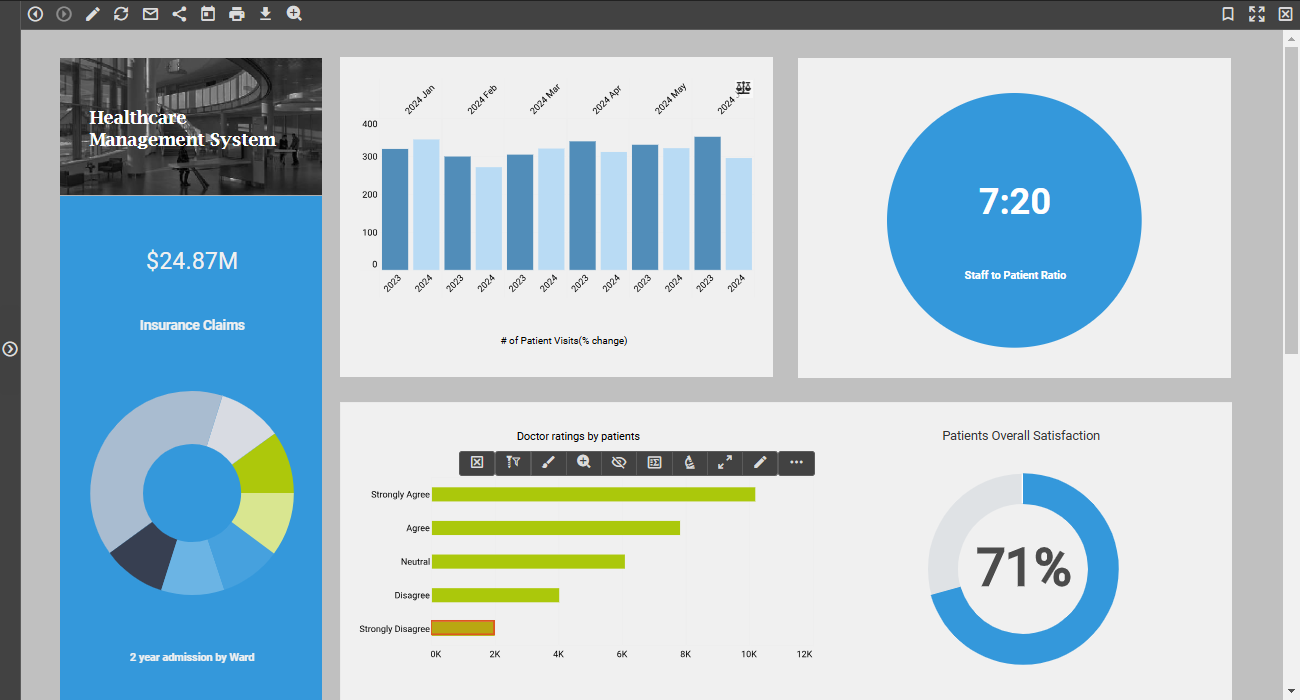
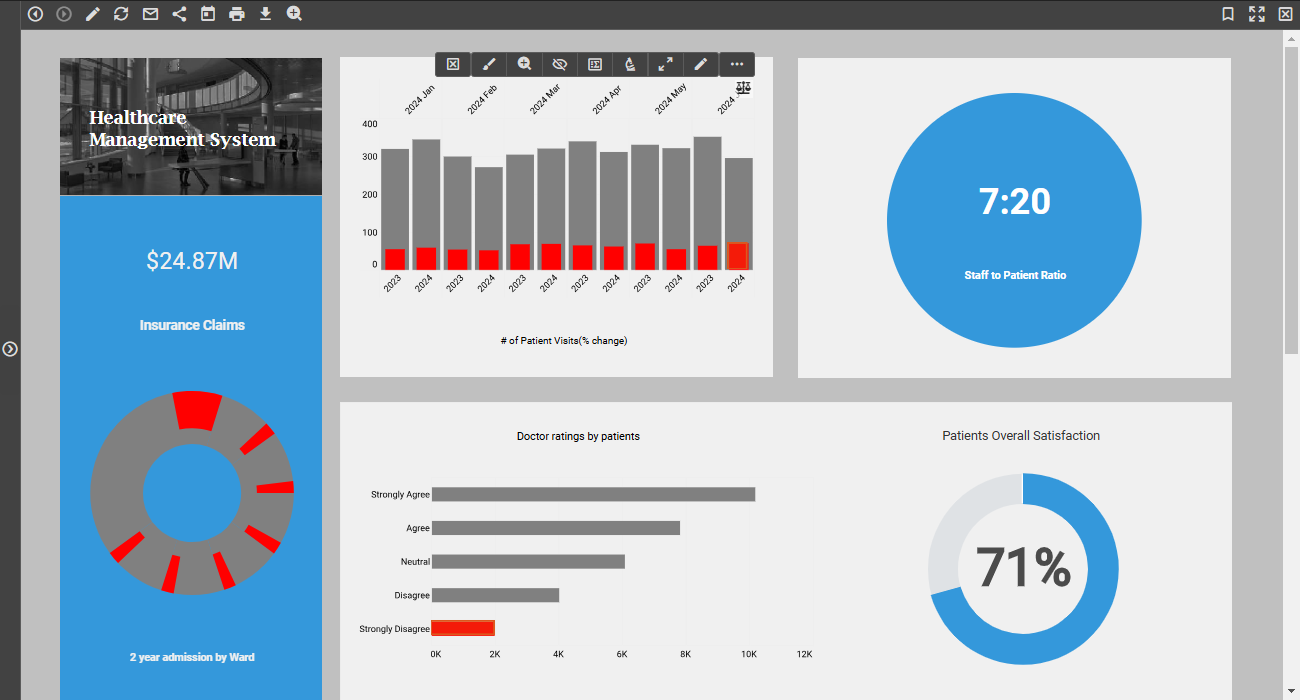
Default visualization toolbar
Each visual component's toolbar offers the most common self-service features.
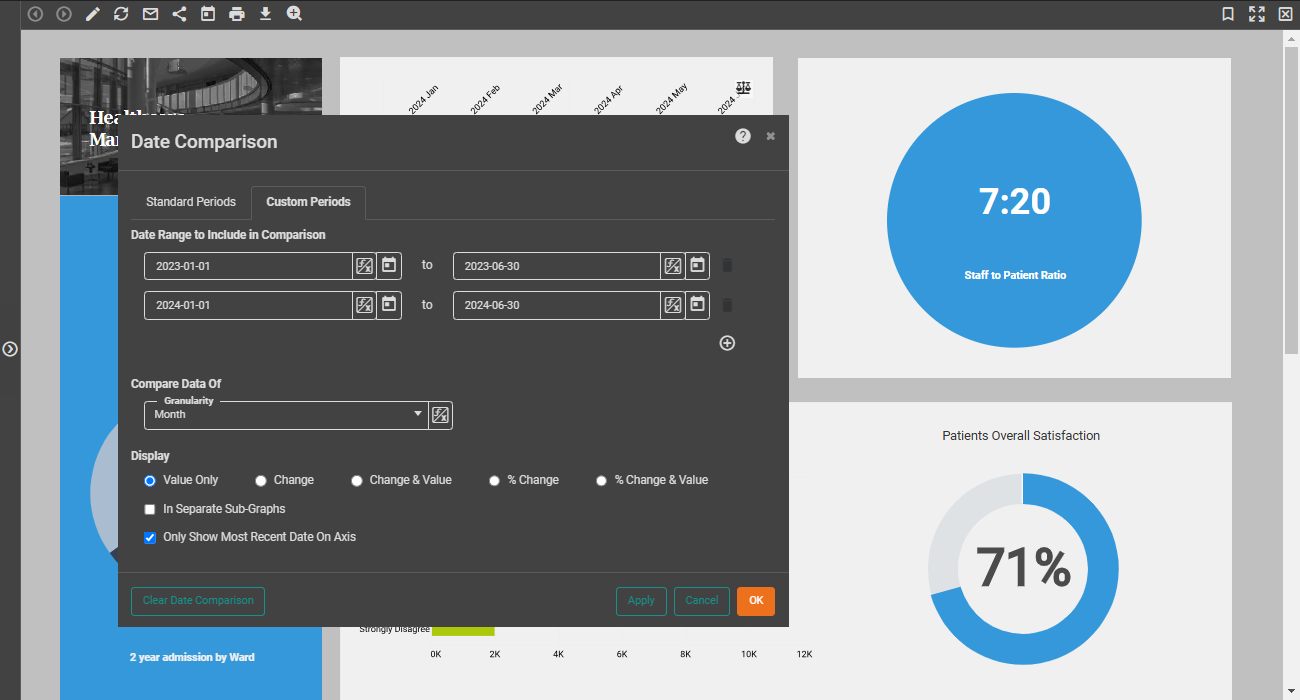
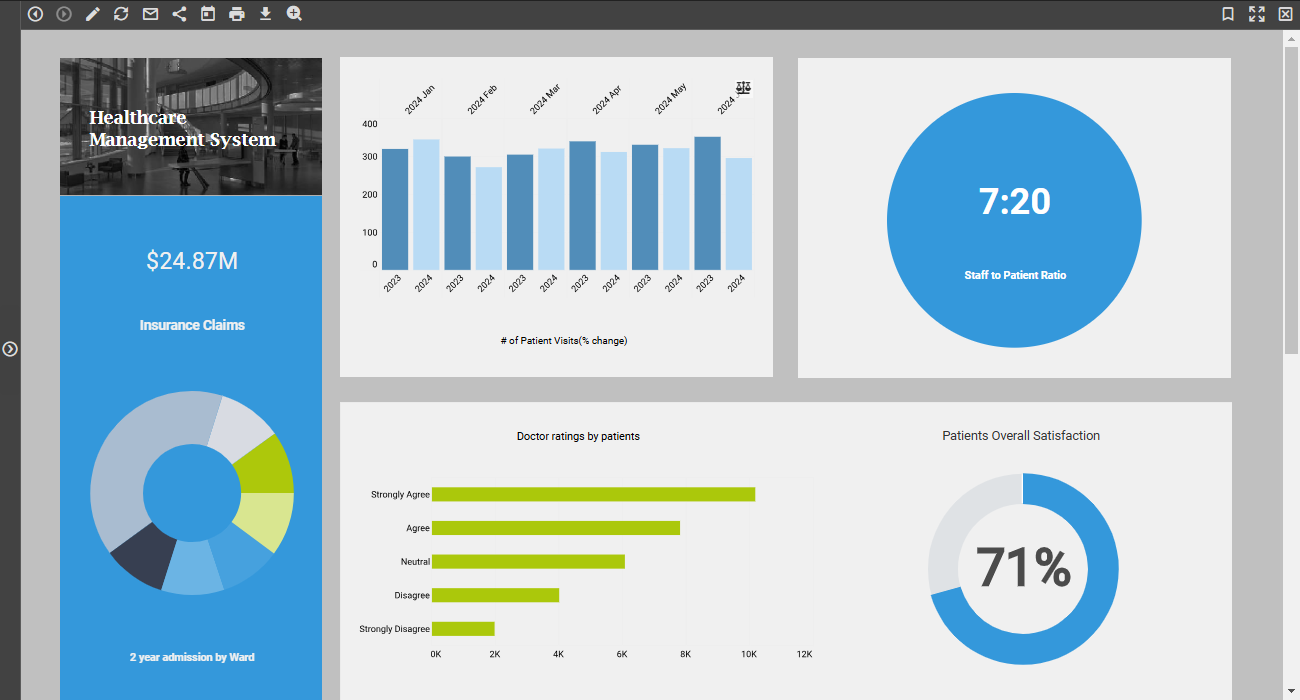
Date-based comparison
Visualizations that include dates can be configured with preset comparisons, such as against the previous year. They also automatically provide self-service date comparison, allowing users to set their own parameters.
Control components
Selection lists, dropdown boxes, calendars, and more enable filtering and other controls at the dashboard level.
Personalized advanced self-service
Advanced self-service, including designer-level visualization editing, can be selectively enabled. Edits are saved as personal or shared bookmarks.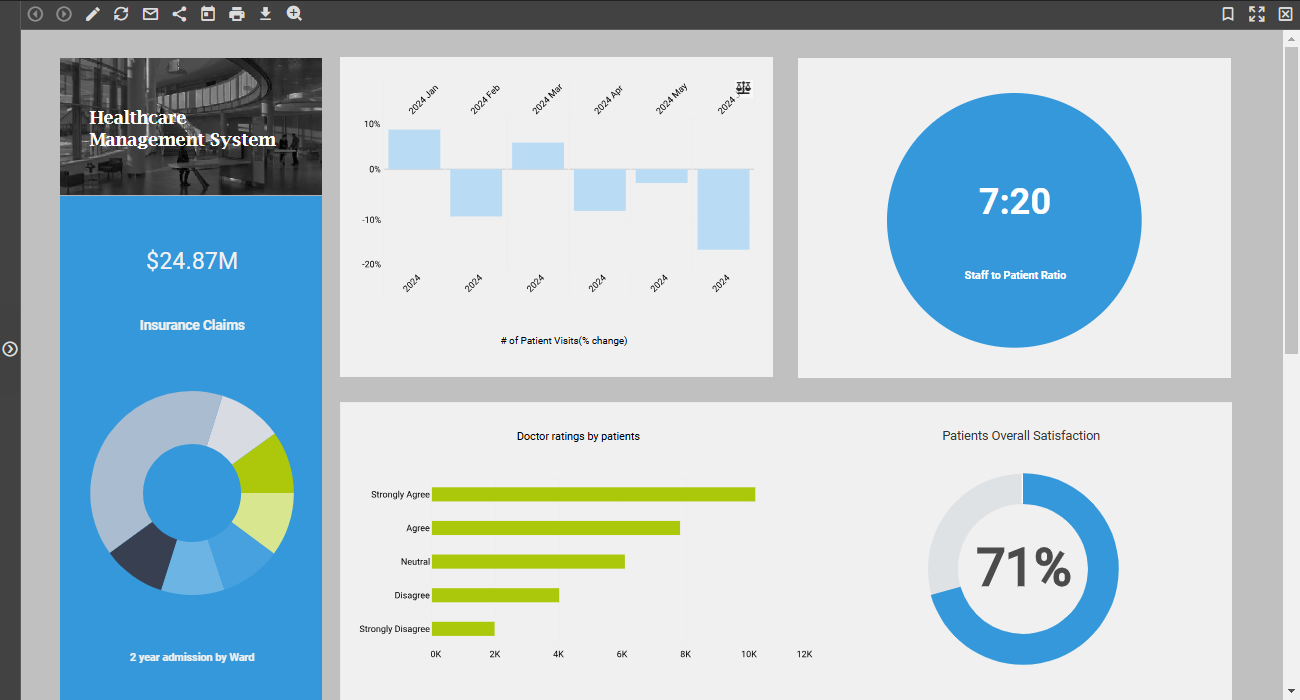

Materialize for a high speed cache

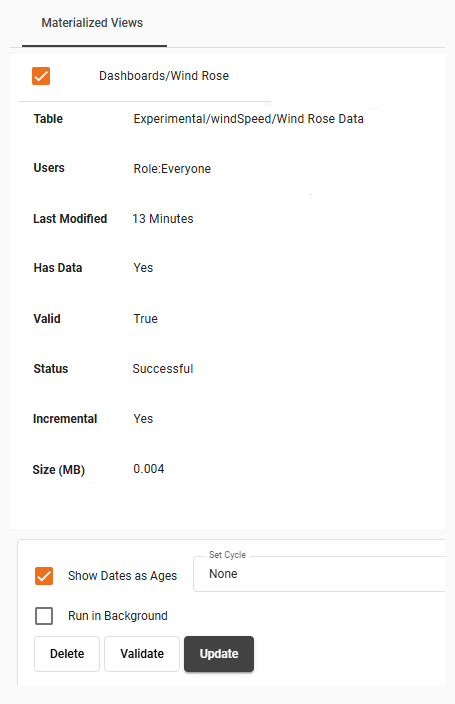
Visualizations can be materialized in real-time or scheduled by administrators and end users with options for incremental or full data refresh.