InetSoft Data Intelligence
The Importance of Modeling Plus Viewing for Delivering Efficient Business Intelligence
A data driven business needs to empower everybody, from C-level executives to frontline workers, with intelligence from data to make smart business decisions.
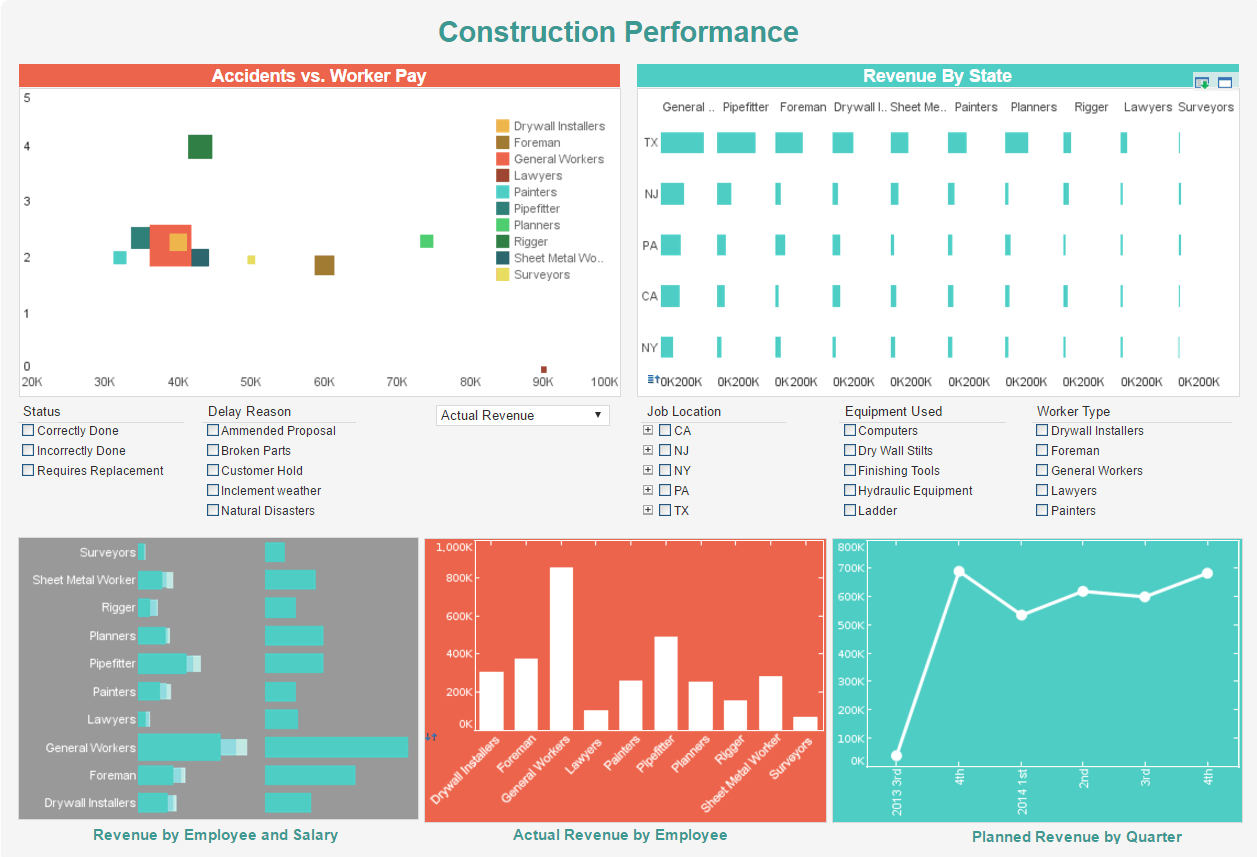
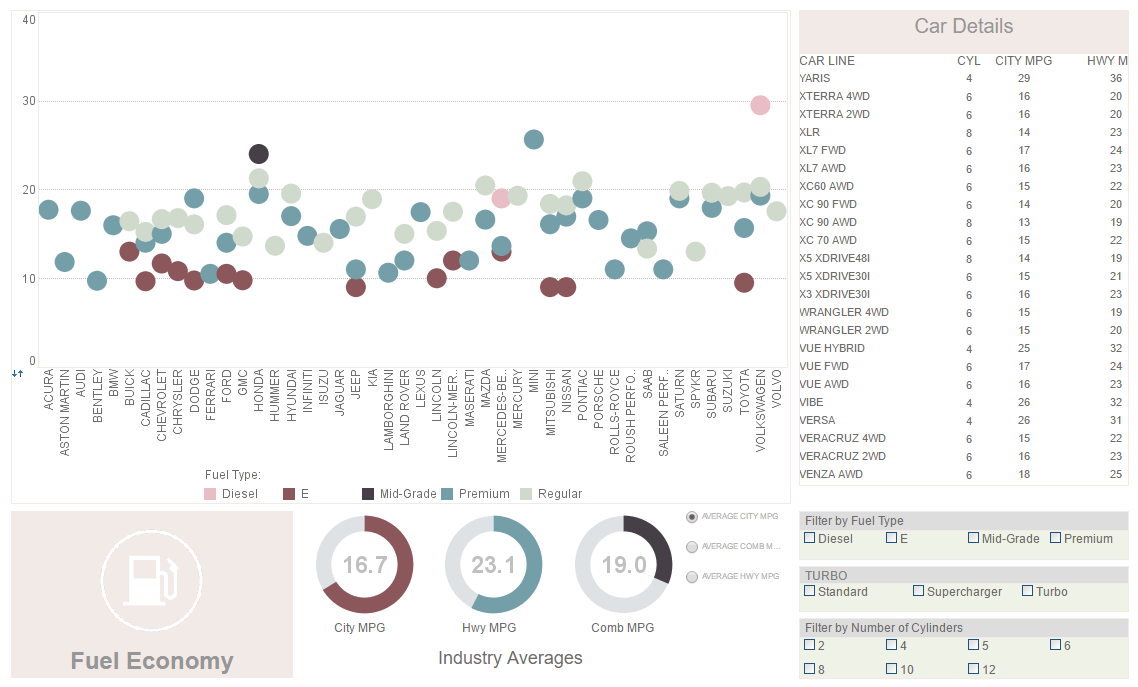
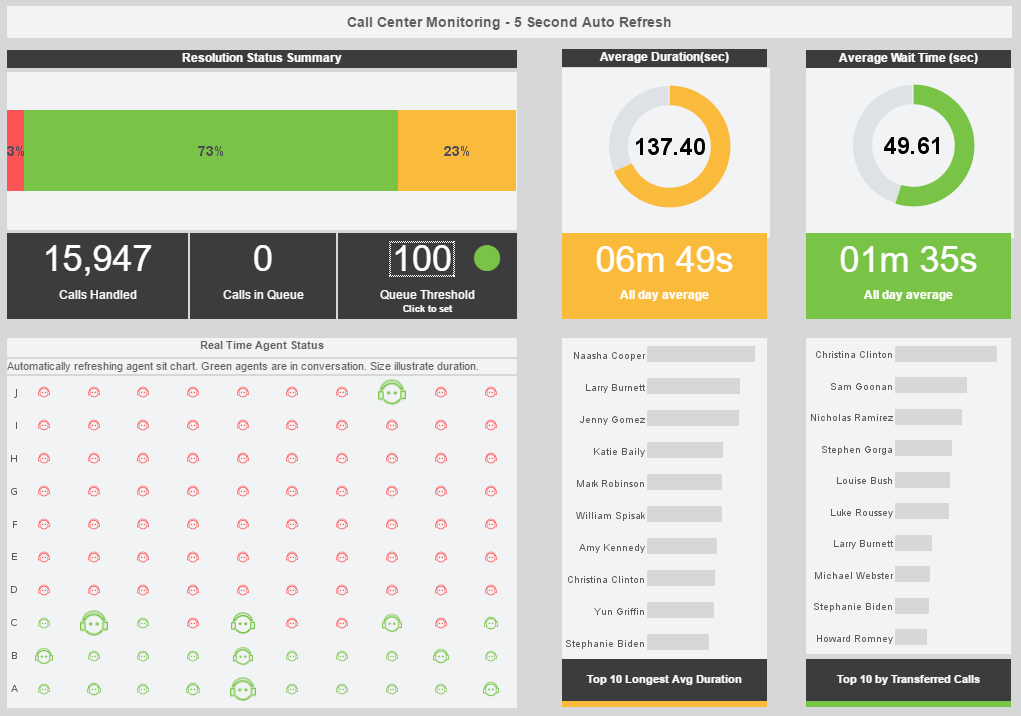
Recent advances in business intelligence (BI), particularly the wide adoption of visualization technology, have greatly expanded and simplified accessibility of data. However, visual dashboards are still just one step forward in the pursuit of self-service BI because they are limited to pre-designed interactivity for end users.
The new frontier of data science (DS) is opening a new world of intelligence. The ability to process a great amount of data of ever expanding variety is within reach for many, thanks to low-cost cloud computing and open source technology. Machines with advanced learning algorithms are extracting intelligence autonomously, but the insight rewards of data science are hard to access for non-technical users.
InetSoft Data Intelligence's architecture mashes up and democratizes BI and DS. It not only simplifies the process for analysts and data scientists but also enables "citizen developers" to self-serve to their best ability. This flexibility is supported by separated, yet intertwined data modeling and data viewing.
| #1 Ranking: Read how InetSoft was rated #1 for user adoption in G2's user survey-based index | Read More |
Data Modeling Plus Data Viewing
Visualization technology provides a great interactive "view" into data. But any effective data view, including visualization, depends on the ability to access, transform, cleanse and mash up data. No matter whether data is structured, semi-structured, or unstructured, it needs to be prepared for data viewing. In other words, data first needs to be marshaled into a useful "model."
A data model forms the foundation for a data view, but it should not be coupled to a single data view. Modeled data is, in itself, an important asset. In many cases, it is even more valuable than the initial view it is associated with. When these data models are organized and exposed to various users, they can be further manipulated and mashed up for future, unforeseen views and analysis.
Live Data Modeling
The traditional static data model for relational databases or data warehouses is no longer sufficient for today's fast changing data environment. The new "live" data model exhibits some distinct characteristics:
Implied & Evolving
Traditional databases and data warehouses, defined by a formal and static model, are important components of the new paradigm. However, fast growing data, for example JSON files, has implied and dynamically evolving models. Some data, such as unstructured text, only develops a model after transformation.
Iterative & Incremental
Data models are a result of the iterative process of creating visualizations for business requirements and the business users' exploration of data. The process is inherently experiment-oriented and needs fast adjustment cycles. Models proven useful for data views are incrementally accumulated.
Multi-disciplined & Collaborative
Depending on the nature of data, data modeling can require different skill sets. Business analysts can easily model files and databases. But API-accessible data requires developers. Statistics, machine learnable data, and data lakes are best modeled by data scientists. At the end, data models will need to be mashed up across multiple sources to deliver business results.
Diversified Data Views
Data views are tools for BI and data professionals as well as end users. For professionals, the ultimate goal is to create and share flexible views for end users. For end users, flexible interactivity in professionally created views is a great starting point. But more importantly, the environment must allow them to grow beyond pre-designed views in order to achieve self-service. Data views, therefore, need multi-faceted capabilities to serve different stakeholders.
Iterative & Intertwined Professional Design
For professionals, data visualizing is a natural companion to data modeling. These two functions are intertwined and are used iteratively for experimenting and refining. This process not only produces powerful end user views such as dashboards but also generates reusable data models for applications beyond the originally conceived views. For example, a data model created for an executive dashboard can also be the base for generating a detailed, paginated report for operational staff.
Multi-Faceted Self-Service
Users' various responsibilities and skill levels dictate that they will need different levels of self-service. For casual users, a no-training-required, guided data view wizard could be the most productive starting point. For power users, they may want to expand upon existing views or create new views from existing data models. For data savvy users, they can introduce new data and mash it up with existing models. These self-service tools also need to be easily accessible, such as with one-click launch in a browser, so that users can dynamically experiment and grow into self-service "citizen developers" without much IT support.
Limitlessly Scalable
By nature, data models are metadata which describe underlying source data. But performance can be a bottleneck if data is simply extracted from sources for data views. Self-service, ad hoc views can create other unanticipated operational performance issues. Therefore, a view must be materializable so that it actually caches data. However, a cache is not a simple duplication of data. It is optimized for the data views to enable rapid responsiveness and minimum resource consumption.
InetSoft's Big Data Based Platform
The conceptual framework of combining data modeling and data viewing must be supported by a robust platform that allows all stakeholders to collaborate and work as one system. InetSoft actualizes these concepts with the following technology:
Live Data Modeling
The Data Mashup Engine and its Data Block on-the-fly data modeling user interface (UI) is the core. In supporting the rapid iterative process, Data Blocks are built as intertwined elements of a professional data view design UI, visualization dashboards, and paginated reports.
Diversified Data Viewing
Beyond professionally designed views such as visualization dashboards and paginated reports, the Guided Report Wizard and Visualization Composer are readily accessible tools for self-service citizen developers with a 100% inside-the-browser experience.
The InetSoft platform can be deployed on a single cloud or on-premise server. But when data becomes big or advanced data intelligence is called for, the data engine can be distributed into a fully integrated Apache Hadoop/Spark-based Big Data cluster. InetSoft's Big-Data-in-a-Box delivers the de-facto industry standard Hadoop/Spark pre-configured so that domain-specific skills and administrative demands are minimized. This platform ensures a high-performance, low-cost solution that brings data intelligence to all.


