Better Hyperion Dashboard Reporting
Looking for a better dashboard reporting solution for your Hyperion system? InetSoft, a pioneer in self-service business intelligence, offers an easy to deploy business intelligence platform that will streamline your consolidation, reporting, and performance management functions.
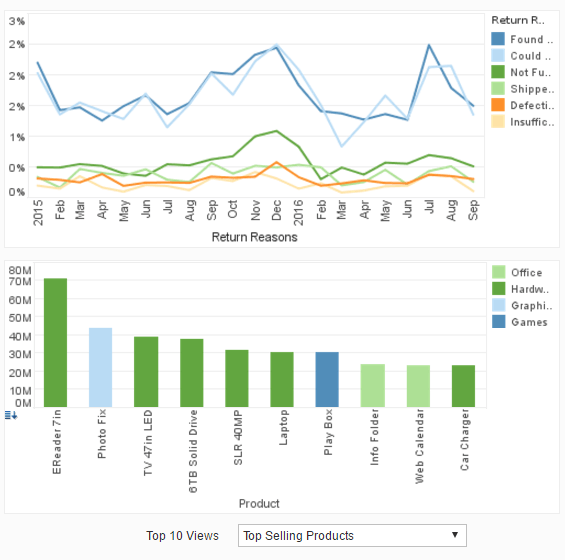
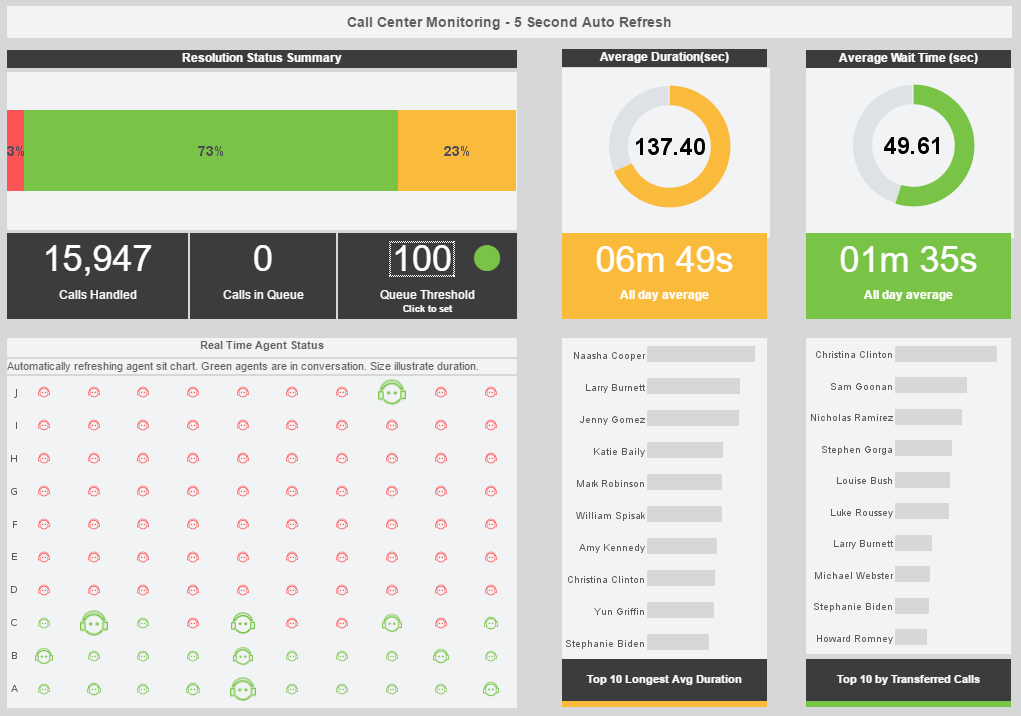
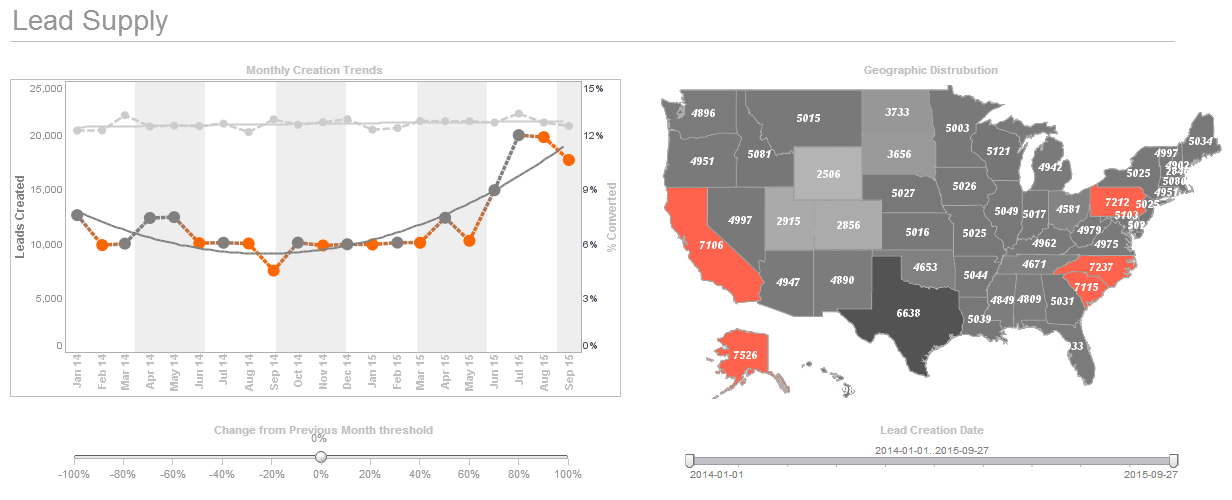
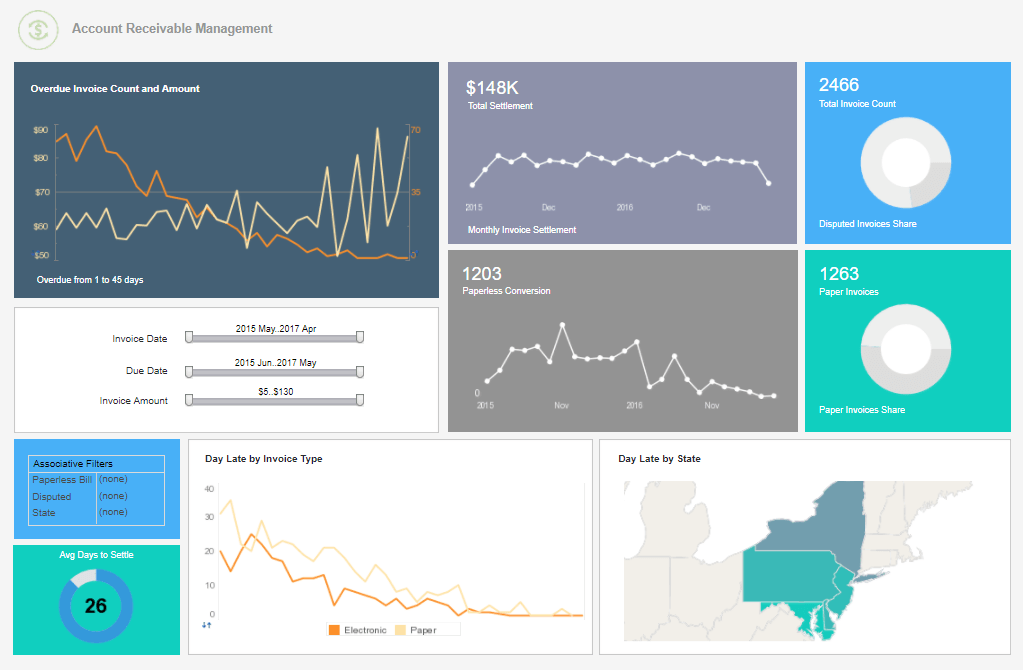
Whereas Hyperion is a sophisticated BI tool for business performance, InetSoft's StyleBI provides a different level of interactivity and dashboard appeal. While other vendors offer advanced tools for operational use only, our software provides easy access and usage to any and all users with unique and intuitive data mashup capabilities. This allows users to combine disparate data from a multitude of supported data sources, including Hyperion Essbase.
StyleBI employs an intuitive user interface that accelerates the usage of BI. Requirements that include reporting, OLAP, scorecards, dashboards, visualization, and ad hoc analysis are all met in one unified application.
Register for a personalized demo and pricing.

Upgrade Your Hyperion Dashboard Reporting
StyleBI is a sophisticated platform providing dashboards and reports that are customizable for any financial organization. Do you require the most current dashboard system to support your strategic and operational management decisions? Our software is capable of creating formal financial reports as well as rich, interactive dashboards.
We provide the easiest, most agile, and robust solutions to help everyone from analysts to executive management understand budget performance, investment and operational risk, compliance, audit trails, and more. All of this is possible from a web based application that can be used with standard browsers and mobile devices.
 |
Read the top 10 reasons for selecting InetSoft as your BI partner. |
Data Access and Mashup Capabilities
- Real-time data mashup Data Block™ architecture
- Professional atomic data block modeling tool
- Web based data mashup accessible by end users
- Easy connectivity to relational databases (JDBC), multidimensional databases, XML, SOAP, Java beans (POJO), Microsoft Excel, flat files, OLAP cubes, SAP, PeopleSoft, JD Edwards, and Siebel CRM
- Security control at the data cell level for users, roles and groups
- Agile mashup across multiple domains and multiple data sources
- High performance scalability for large data sets, and large volumes of users via Data Grid Cache Technology
- Embedded dashboarding - a Java-style API and multiple integration points allow developers maximum control over programmatic use of dashboarding and reporting

Read what InetSoft customers and partners have said about their selection of Style Scope for their solution for dashboard reporting. |


Visualizations, Dashboards and Visual Analysis
- Web based mobile dashboards accessible from devices including iPhones,smartphones, Apple based & Android-based tablets
- Use standard web browsers e.g., Chrome, Internet Explorer, Firefox, Safari
- Unlimited multi-dimensional charting
- Drill down across views and into details
- Wide range of robust chart types including custom geographic mapping
- Visualization view re-use and collaboration
- Drag & drop design, spreadsheet-like design
- Use charts, maps, gauges, thermometers, and other visual displays
- Dual purpose input/output elements
- Views assembled from sub-level views
- Monitoring and analysis oriented views
- Export to Excel, PowerPoint, PDF, RTF-Word, CSV, PostScript, Text, and SVG
- Snapshot archiving
 |
Read why choosing InetSoft's cloud-flexible BI provides advantages over other BI options. |
What Are the Drawbacks of Hyperion Dashboards and Reporting?
Hyperion Dashboards and Reporting, often associated with Oracle Hyperion products, have been widely used for financial reporting, budgeting, and planning in enterprises. While they offer several advantages, it's essential to consider potential drawbacks as well. Here are some drawbacks associated with Hyperion Dashboards and Reporting:
- Complex Implementation:
- Hyperion solutions can be complex to implement. The setup and configuration may require specialized skills and expertise, and organizations might need to invest in training for their staff.
- Costly Licensing and Maintenance:
- The licensing and maintenance costs for Hyperion products can be significant. Small and medium-sized businesses might find it challenging to justify the expenses associated with these solutions.
- Resource Intensive:
- Running Hyperion Dashboards and Reporting can be resource-intensive, requiring robust hardware infrastructure. This might pose challenges for organizations with limited IT resources or those operating in cloud environments with cost considerations.
- Steep Learning Curve:
- Users, especially those not familiar with Hyperion products, might face a steep learning curve. This can impact productivity and hinder the adoption of the tools across different departments.
- Integration Challenges:
- Integrating Hyperion with other enterprise systems can sometimes be challenging. Compatibility issues may arise, leading to data inconsistencies or delays in reporting.
- Limited Flexibility:
- Some users might find the customization options limiting. Adapting Hyperion Dashboards to specific business needs may require additional development efforts, and users may not have the flexibility they desire.
- Dependency on IT:
- Hyperion Dashboards often rely on IT teams for maintenance, updates, and troubleshooting. This dependency can lead to delays in addressing issues or implementing changes requested by business users.
- User Interface Design:
- While Hyperion Dashboards provide functionality, the user interface design may not be as intuitive or visually appealing as some other modern reporting tools. This could impact user satisfaction and adoption rates.
- Scalability Issues:
- As business data grows, organizations may face scalability challenges. Ensuring that Hyperion Dashboards and Reporting can handle increasing amounts of data without compromising performance may require additional investments.
- Evolution and Support Concerns:
- Oracle's focus and support for Hyperion products may evolve over time. Organizations need to consider the long-term viability and future roadmap of these products to ensure ongoing support and updates.
More Articles About InetSoft's Replacement for Hyperion Dashboards
Data Infrastructure Investment - We found some studies that were done by some by universities and some by analytics firms that said that certain companies invested in IT in a very big way, meaning they changed their percentage of revenue, or they change their budgets significantly, or they started to really look at their data management and...
How Do you Analyze Export Data - Trade statistics is all about understanding the pattern of trade, trade policies of a particular country, and specific trade blocks in general. It is keeping track of various policies and programs introduced by the Trade blocks all over the world. It requires specific tools to analyze the strategic position of export conditions of the world...
Investment Operations Dashboard Example - Investment operations analysts are essential to the financial sector because they make sure that investment operations run smoothly and effectively. These experts depend on analytics and key performance indicators (KPIs) to oversee and improve investment processes. We will examine the crucial KPIs and analytics utilized by investment operations analysts in this...
Resource Allocation Metrics Dashboard - The distribution of resources during a crisis may be the difference between a quick recovery and a drawn-out suffering. Organizations may employ personnel, money, and equipment more efficiently by using KPIs linked to resource allocation. Metrics relating to "Resource Utilization" evaluate how efficiently resources are being utilized. "Budget Variance" KPIs...


