Data Intelligence for Construction
For the construction industry, it has become essential to have large-scale automated data monitoring and report generating functionality incorporated into existing operational systems to manage a multitude of data. Modern construction projects require timely reports to meet project schedules and costs accordingly.
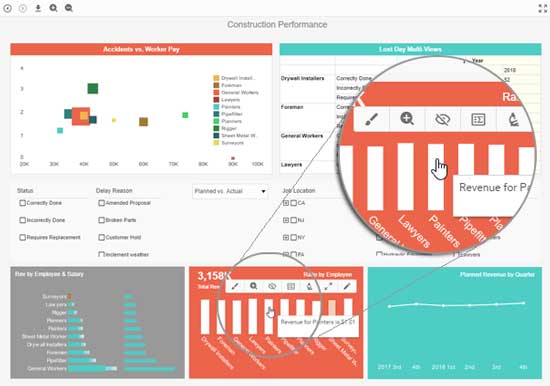
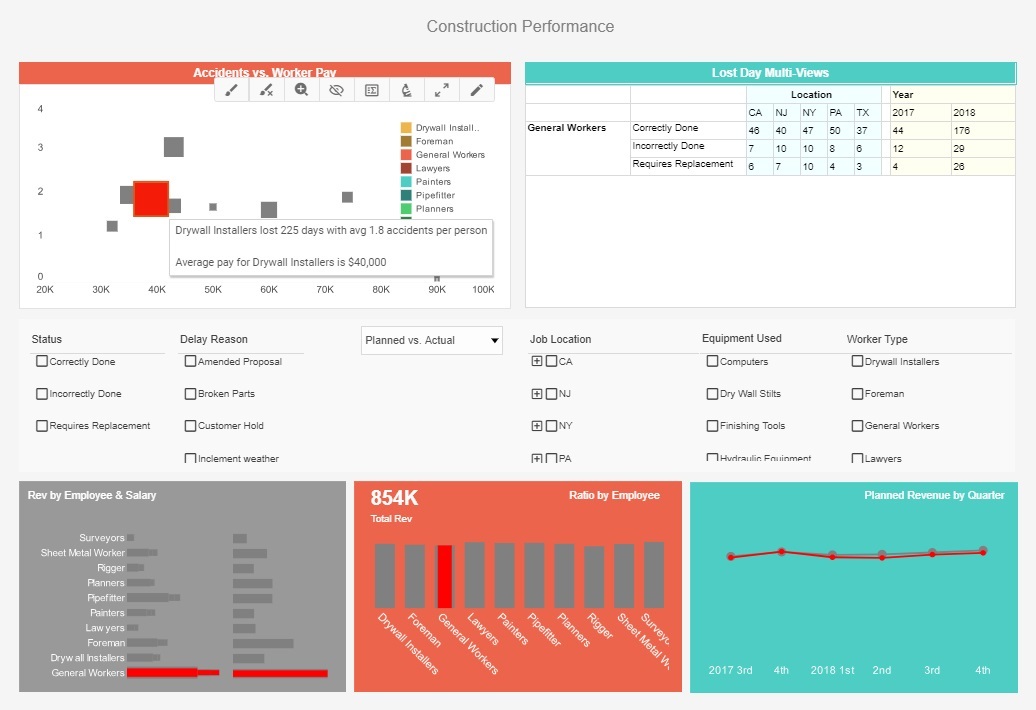
Visualization Dashboards for the Construction Industry
InetSoft provides a comprehensive data analytics tool for all construction analytics and reporting requirements of executives and stakeholders alike.
Flexibly-priced and easier to deploy and administer than traditional business intelligence solutions, InetSoft's Java-based, zero-client application makes an attractive option for evaluation.
Spotlight on Construction Industry Applications
An increasing number of construction companies are needing information that is spread across multiple data formats in databases for employee payrolls, job hazards, csv files for current orders, reports sent out to stakeholders merged into single reports.
InetSoft's business intelligence software offers a customizable security management system at the user and data levels that allows different users (foremen, project managers, company executives and stakeholders) with different data access privileges to view the appropriate information. Construction analytics and dashboard features allow company executives to perform analytical operations that 'slice and dice' data from summary company statistics to the each employee type to perform cost benefit analysis.
Some construction dashboard features allow project managers to track and manage shipments as well as current roles by employees and sub contractors. Foreman can track individual employee performance to cut down on costs and stick to production timelines more accurately. Additionally, localization features enable report generation for users from non-English speaking backgrounds (Spanish, Chinese, Japanese, etc.).
A Study of Gypsum Management & Supply Inc. (GMS)
GMS is the largest independent distributor of drywall, acoustical and other specialty building materials in the United States and operates in 26 states, through a network of 43 subsidiary companies and more than 130 distribution centers. GMS is also a leading distributor of acoustical products including ceiling tile, grid, and FRP panels used in commercial applications.
In addition to wallboard and acoustical products, GMS distributes metal framing, insulation, ready-mix joint compound, and various other related interior construction products. In total, GMS and its subsidiary companies distribute over 10,000 unique products.
GMS users generate and print reports, create graphs, and view a snapshot of their current business performance. Dashboards and reports will be created from data mashups across multiple data sources. For the first time key performance measures will be consolidated into one system at GMS to provide easy access and enabling even better informed business decisions. GMS cited ease of integration with existing operational systems, flexibility in the design process and cost-effectiveness from a licensing perspective as key factors in the decision to select StyleBI.
Other BI Applications in Construction
- Accident rate monitoring
- Cash available forecasting
- Client satisfaction reporting
- General administration
- Project management
- Worker safety reporting
- Working day efficiency analysis
What KPIs Should Be on a Construction Project Management Dashboard?
1. Downtime hoursDowntime is one of the worst drivers of cost overruns. Downtime can result from outside factors, such as weather, waiting for shipments, equipment breaking, or internal ones such as work stoppages, sick employees, or accidents. Two main groupings of these metrics are equipment downtime and labor downtime.
2. Installation defect %
Workers skill-levels, training, and supervision influence a construction team's workmanship. The percentage of improperly completed projects tells you how carefully they follow instructions and complete their duties. The installation defect rate can be measured through random audits or by having managers and team-leaders verify the quality of their direct reports' work.
3. Supplier defect %
Conducting inspections of vendor shipments let's you count the defect rate among raw materials, equipment, tools and other supplies. Tracking this information tells you about the reliability and consistency of your construction suppliers. Having consistent materials is important for producing buildings that are structurally sound. This metric can help you make choices about where to purchase materials.
4. Rework expenses
Record the cost of repairing a project if someone misplaced something on site, work was stopped due to an accident, or construction work was redone due to a product recall. When recording data for rework KPIs, include a root cause description so that you can identify the issues that contribute to high rework costs. Identify ongoing quality control issues by documenting average rework costs per project and total rework costs per reporting period.
5. Inspection score
During inspections at the end of a construction project, you may receive a score that describes how well the completed project complies with local codes and regulations. By recording inspection results and maintaining an average number of inspection results, you can provide a benchmark to use as a guide for future projects.
6. % of passed inspections
A failing inspection requires additional effort by the team to fix enough aspects of the construction project to earn a passing score. Evaluate how additional training, hiring practices, or certification requirements will affect your team's test pass rate.
7. Accident incidents per project
Accidents are major drivers of costs, direct and indirect, completion delays, worker retention problems, not to mention injuries and lawsuits. Incidents are measured by project and categorized by manager.
8. Safety meeting attendance
By tracking individual attendance at safety briefings and other optional training, you can customize this KPI to give employees insight into their personal work habits.
9. % of construction and demolition waste recycled
For any company it is best to minimize waste or not to produce any waste at all. However, as it is not always possible to eliminate waste completely, companies need to try to minimize the impact that the waste they are producing is having on the environment. When we produce waste that is sent to landfill sites or to incinerators, this has commercial as well as environmental implications.
10. # of activities starting on time
This is the time schedule accuracy in estimating the start time of each activity. Keeping track of this number helps pinpoint where downtime can be coming from.
11. Revenue per labor hour
Revenue per hour worked combines these two goals into one KPI that tracks how much revenue a construction professional makes per average hour worked. At the end of the project, calculate the total profit divided by the team's total work hours.
12. Budget variance
Budget variance is the difference between the original budget and current spending. You can also track how often each project hits its projected budget, exceeds its budget, or falls short of its planned budget.
13. Actual construction hours vs planned construction hours
Time track all hours per worker and manager, sum them and compare them to the budgeted hours for the
project.
14. Cost per km
For highway construction projects this is the most common metric summing all costs and dividing by
kilometer
completed.
Reasons Why Organizations Choose InetSoft


"Customer service is the best I've encountered among software vendors. All the technicians are
extremely
knowledgeable, patient and will make every effort to accommodate your schedule and resolve the issue
in a timely
manner. "
- Jack P.
"I spent months looking for the best dashboard/reporting app to suit my business. I literally tried and tested every application out there and I have to say that the StyleBI App is by far the best. It is simple to use and it is absolutely brilliant if you are needing dashboards on custom objects." - Jacki A.
