Data Intelligence for Healthcare
Healthcare organizations gather a large amount of data. Effectively utilizing data is crucial for delivering world class results. Healthcare also spans highly interconnected sectors such as academics, hospitals and pharmaceuticals. Data and its analysis sharing can be highly automated with data intelligence tools.
Interactive Visual Analysis in Healthcare
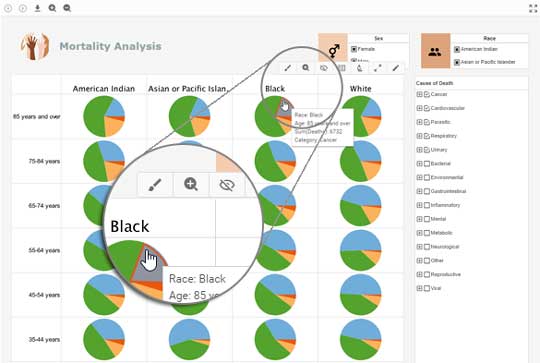
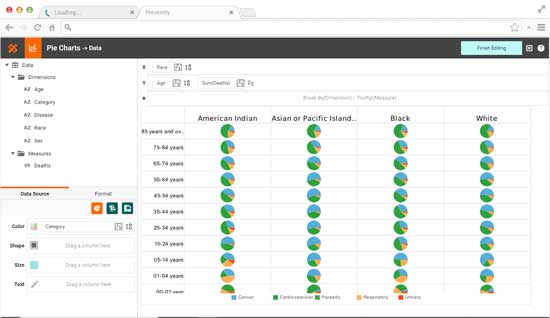
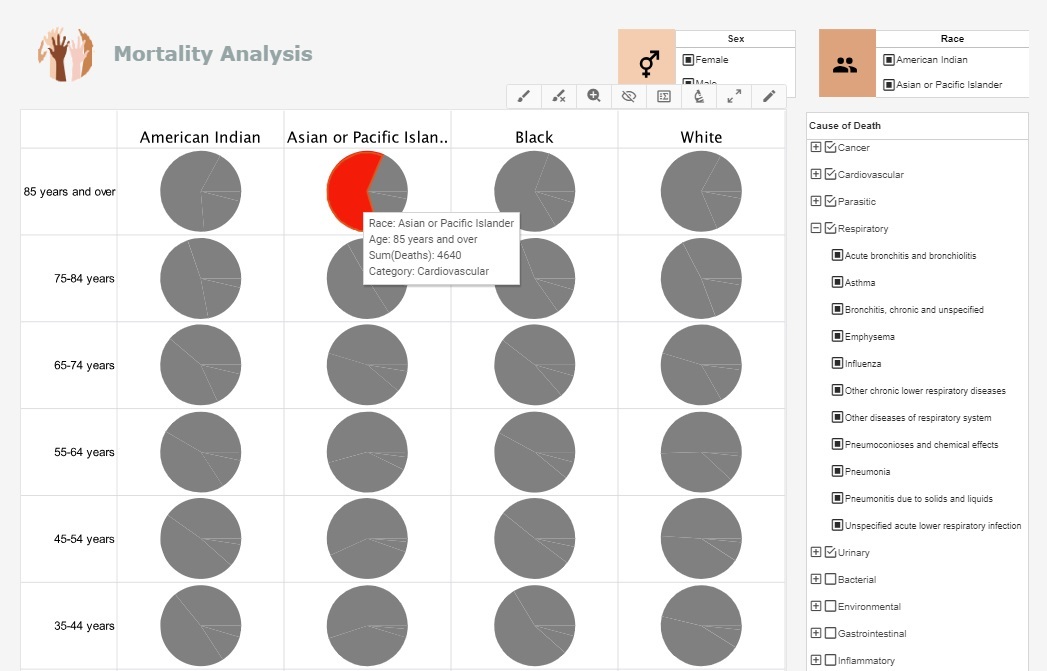
This interactive visual analysis example portrays the rich and interactive nature of InetSoft's dashboard software. A web-based analytical dashboard, the chart uses InetSoft's patented Data Block technology for data mashup purposes, serving as an effective way to analyze multi-dimensional data.
A powerful and effective capability of InetSoft's dashboard solution demonstrated here is the simple sorting mechanism that users have control over. Filtering and sorting is easily done with the radio buttons and color coordinated bar chart that includes an array of categories, causes of death, gender, age, and race. Users can take another step and add more charts, data sets, and/or filtering options for further analysis. InetSoft's healthcare business intelligence solution is geared towards a user-friendly interface that includes an arsenal of useful tools when creating, monitoring, adjusting, or analyzing.
Capabilities of InetSoft's Interactive Visual Analysis
- Compare and analyze data by utilizing customizable filtering options
- Use an easy-to-use point-and-click environment for quick data analysis
- Share visual analyses with others
- Analyze charts and graphs and then select other tabs to see other views or drilldown into details
- View data from multiple sources and formats on one dynamic screen
Other BI Applications in Healthcare
- Business monitoring
- Billing tracking
- General administration
- Human resources
- Schedule management
Reasons Why Organizations Choose InetSoft
"Customer service is the best I've encountered among software vendors. All the technicians are extremely
knowledgeable, patient and will make every effort to accommodate your schedule and resolve the issue in a timely
manner. "
- Jack P.
"I spent months looking for the best dashboard/reporting app to suit my business. I literally tried and tested every application out there and I have to say that the StyleBI App is by far the best. It is simple to use and it is absolutely brilliant if you are needing dashboards on custom objects." - Jacki A.
