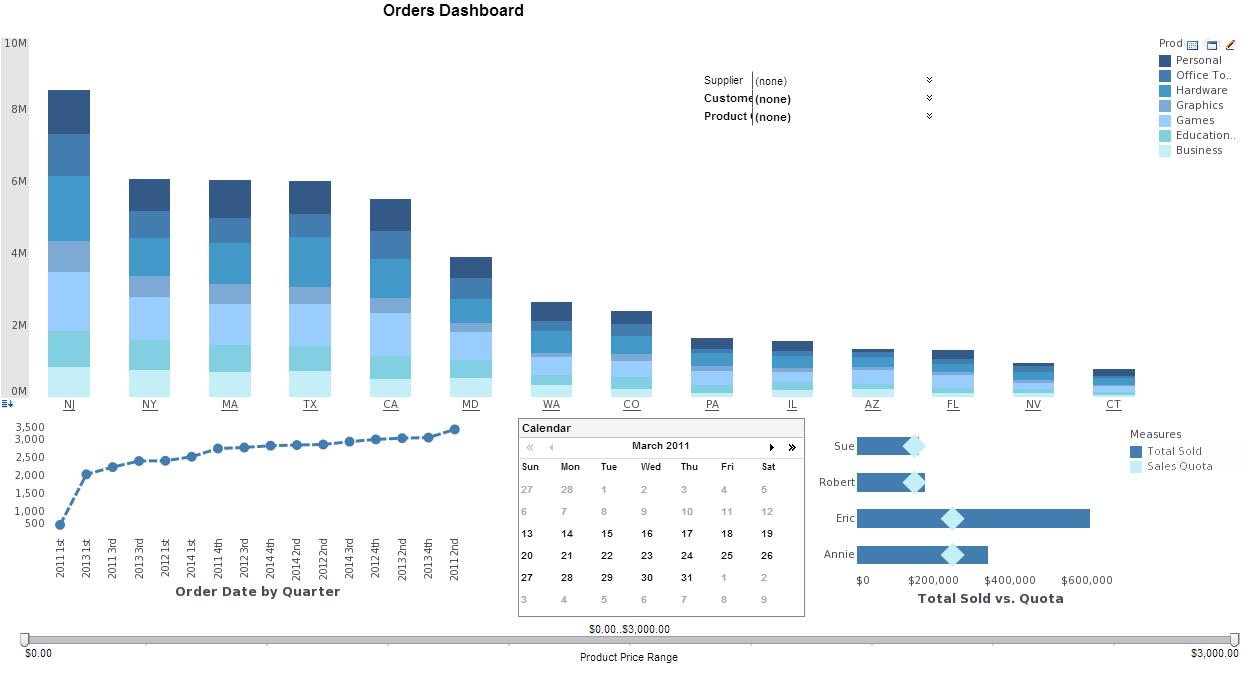
Orders Analysis Dashboard
The Orders Analysis Dashboard below is an example of an interactive web-based analytical dashboard built using InetSoft's software that could be used by a supplier in any industry. This particular chart allows users to track and analyze sales orders of different industries. With a easy-to-use point and click environment, users can also drill down into orders by geography, different suppliers, and/or specific industries for an even more accurate analysis.
With InetSoft's drag and drop design tools, suppliers can quickly build productive analytical tools like this one that monitors and visualizes order statistics from multi-dimensional perspectives to aid users in day-to-day operations, as well as help them keep track of and achieve long term goals and objectives.
| Try It Now | Click on the example below to see how easy it is for users to filter through different data for an in-depth look at desired results! |

Capabilities of the InetSoft's Orders Analysis Dashboard Example
- Monitor, explore, and analyze by filtering and sorting desired information
- Easy to use, modify, and create charts and visuals
- Leverage user-driven data mashup
- Upload and sift through multi-dimensional data to spot trends and aberrations
- Slice and dice data with simple point-and-click method
- Share visual analysis with others
InetSoft's business intelligence application makes a good choice for these key benefits
Easy
- Enjoy a rapid implementation; minimum specialized IT expertise required
- Experience a shallow learning curve for business users; only Excel-level skills needed
- Make it easy for analysts & administrators; no SQL experience required
- Scale up with zero-client deployment and no per-user licensing
Agile
- Provide maximum self-service through ad hoc and visualization analysis
- Enable self-service also at data level: end-user defined data mashup
- Accommodate quick, formal, and experimental changes
Robust
- Address advanced and mass needs
- Run on a high performance, secure infrastructure
