Student Major Analysis Example
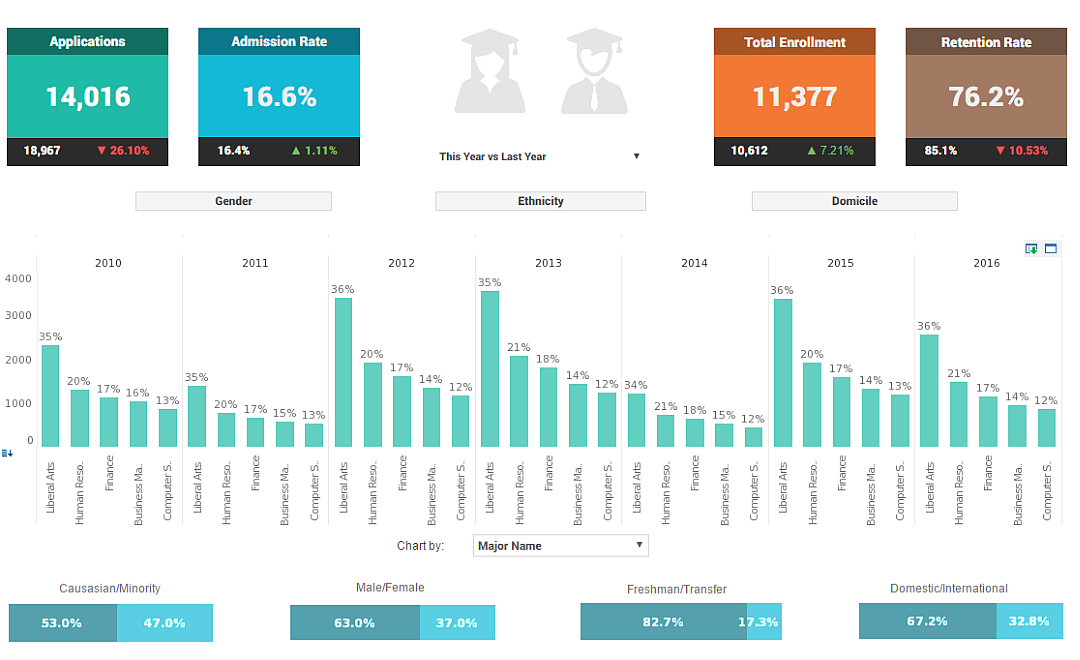
The Student Major Analysis Example is an interactive dashboard detailing the majors of college students in a 16 year time span utilizing InetSoft's cutting-edge business intelligence software. Focusing on numerous majors from different years, this dashboard clearly portrays the statistics with a visually pleasing chart along with a detailed data sheet showing the information with text. Furthermore, along with other data sets, the specific chart below allows users to filter by different majors. This helps improve the analyzation process when digging for specific information. More importantly, InetSoft's solution is easy to use and navigate so that organization members can all have access to the tools and capabilities as well.
With InetSoft's point-and-click environment, users can efficiently and effectively build powerful analytical tools like this one to monitor and easily visualize statistical data. Not only does this enhance everyday business procedures, but also helps record any significant data that may be beneficial for future use.
| Try It Now | Click on the example below to see how easy it is for users to filter through different data for an in-depth look at desired results! |

Capabilities of InetSoft's Student Major Analysis Example
- Easy exploring options with point-and-click environment
- Create charts and other visuals with ease
- Combine data using intuitive data mashup technology, Data Block, with collection of databases
- Upload and compare data side-by-side to spot anything significant
- Filter using multiple filtering and sorting options
- Share visual analysis with others

InetSoft's business intelligence application makes a good choice for these key benefits
Easy
- Enjoy a rapid implementation; minimum specialized IT expertise required
- Experience a shallow learning curve for business users; only Excel-level skills needed
- Make it easy for analysts & administrators; no SQL experience required
- Scale up with zero-client deployment and no per-user licensing
Agile
- Provide maximum self-service through ad hoc and visualization analysis
- Enable self-service also at data level: end-user defined data mashup
- Accommodate quick, formal, and experimental changes
Robust
- Address advanced and mass needs
- Run on a high performance, secure infrastructure
