Serverless BI
that flexes like your cloud
Agile, small-footprint business intelligence powered by data transformation pipeline and
visualization microservices
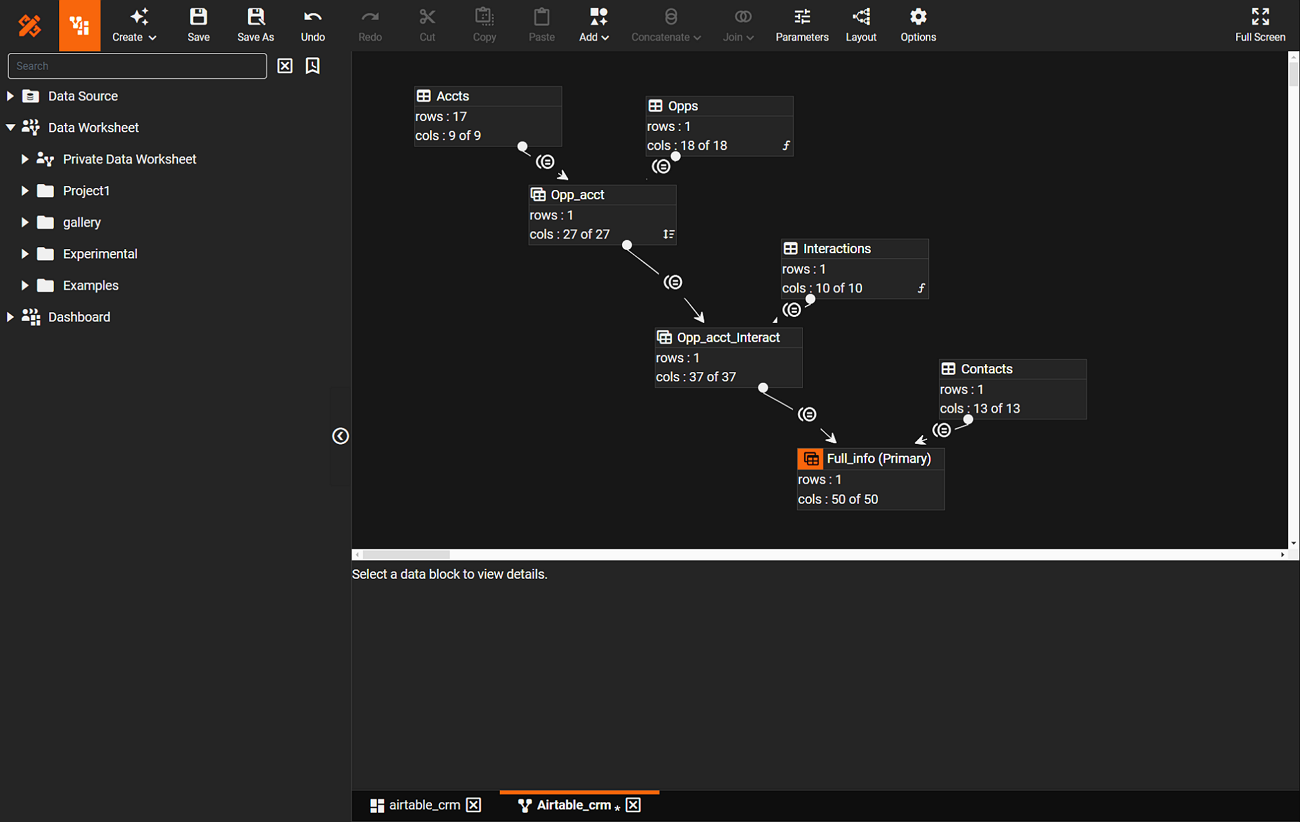

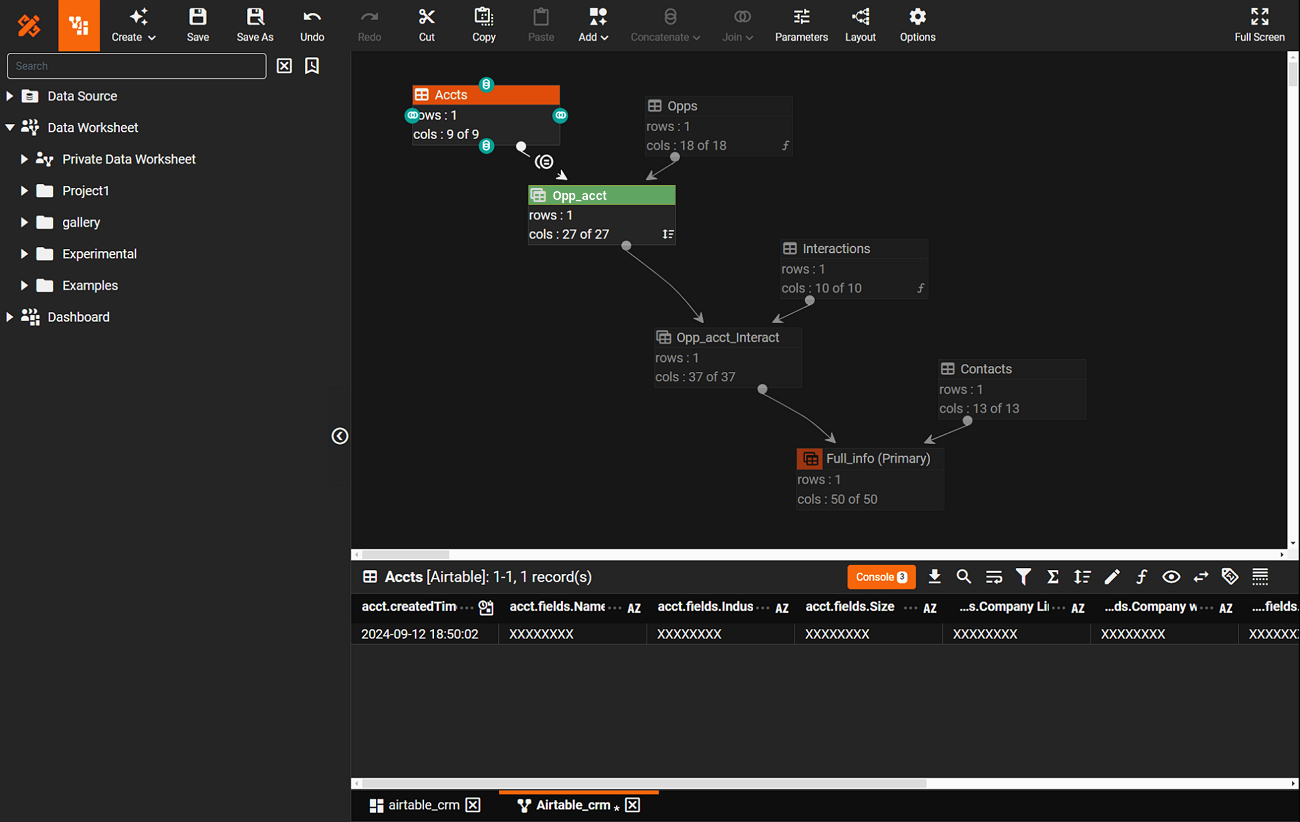
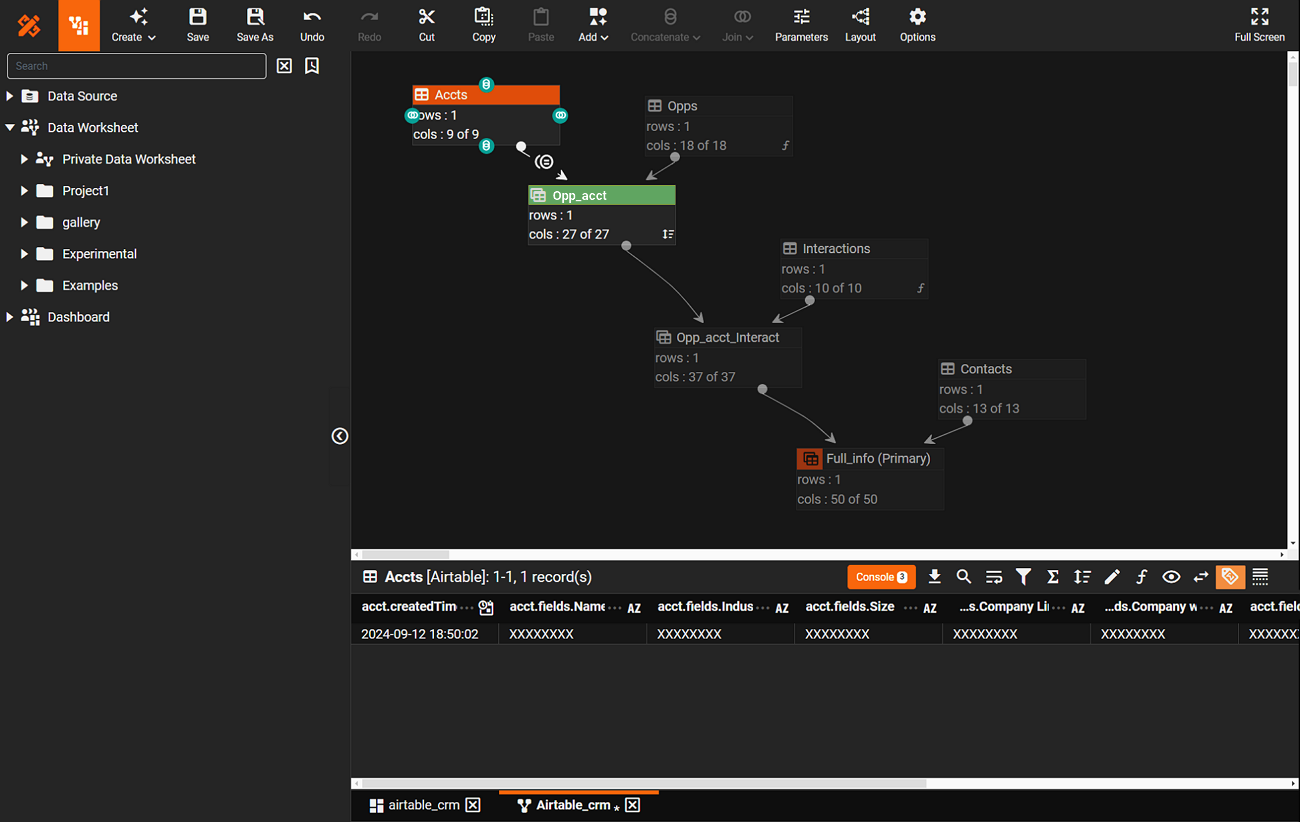
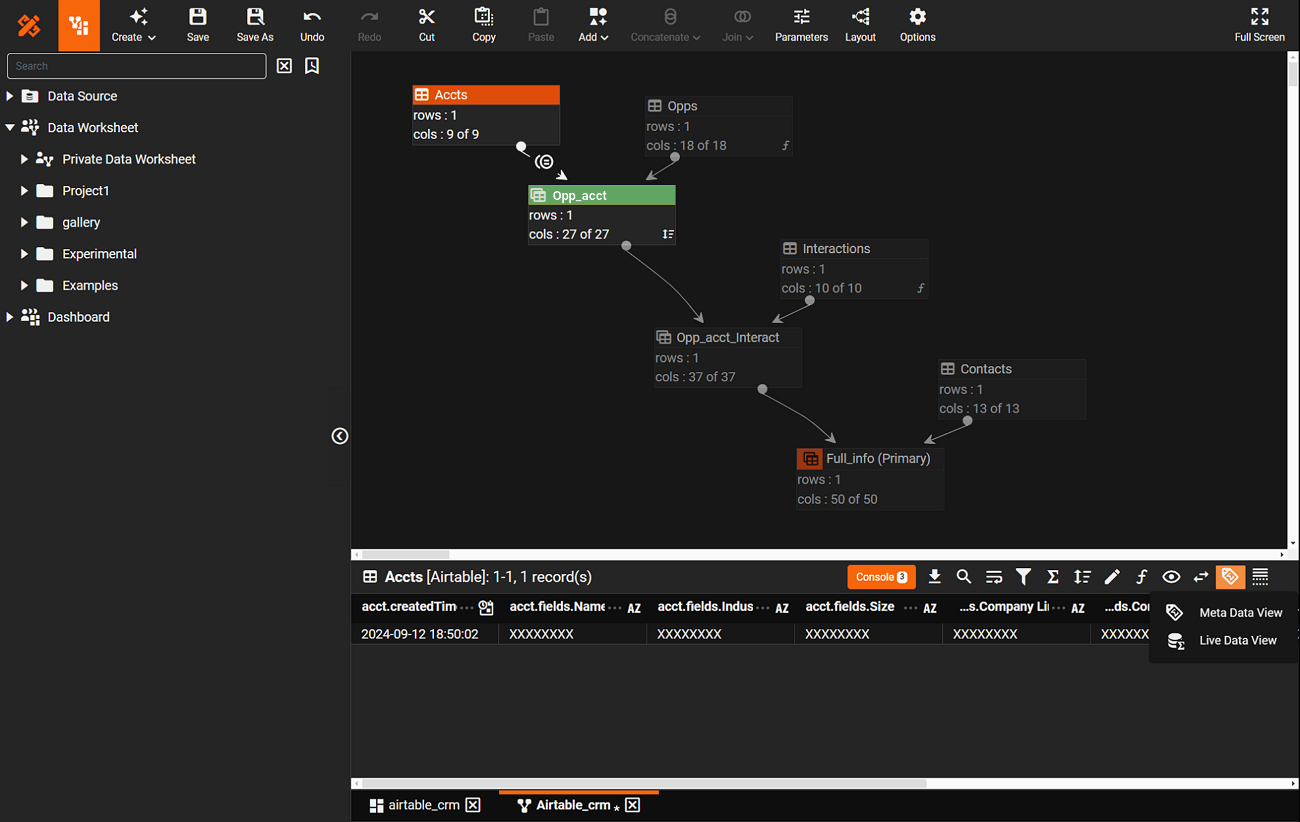
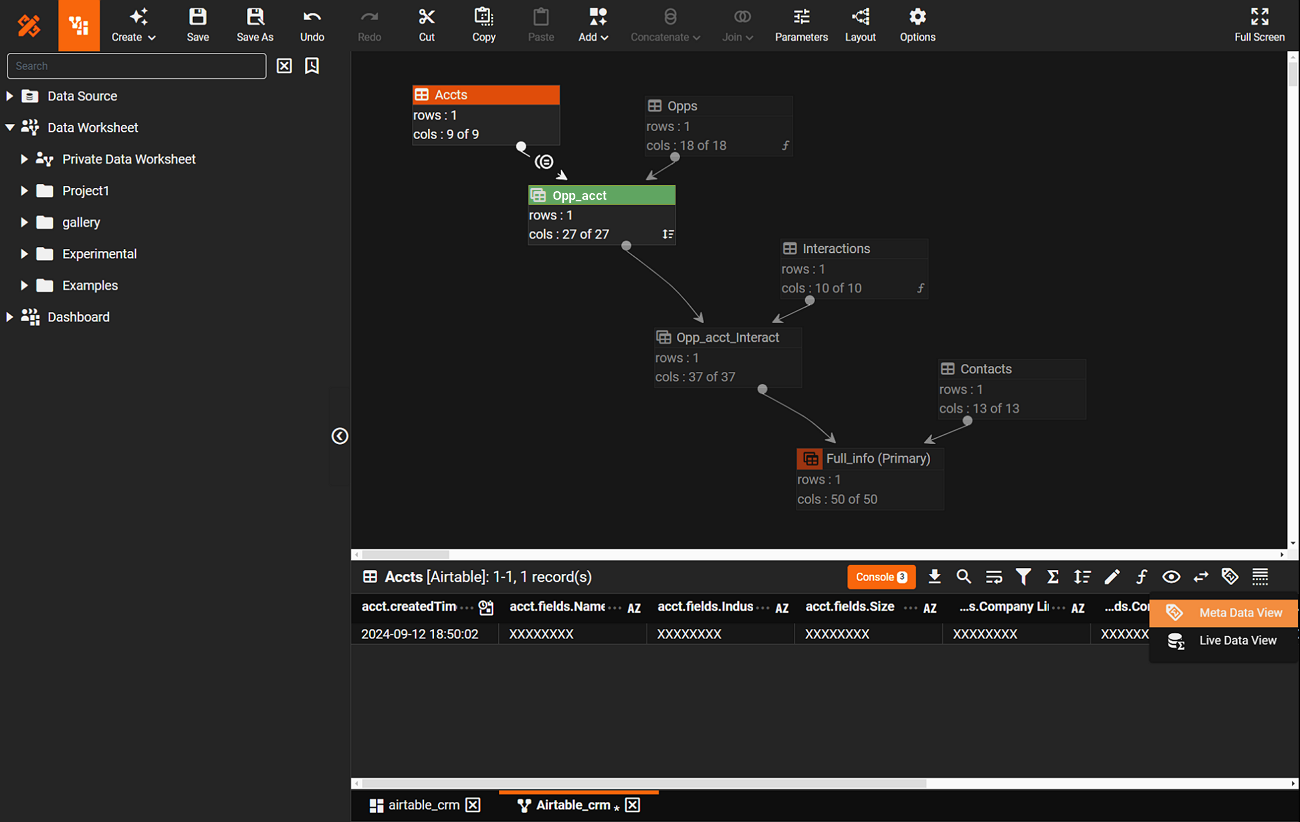
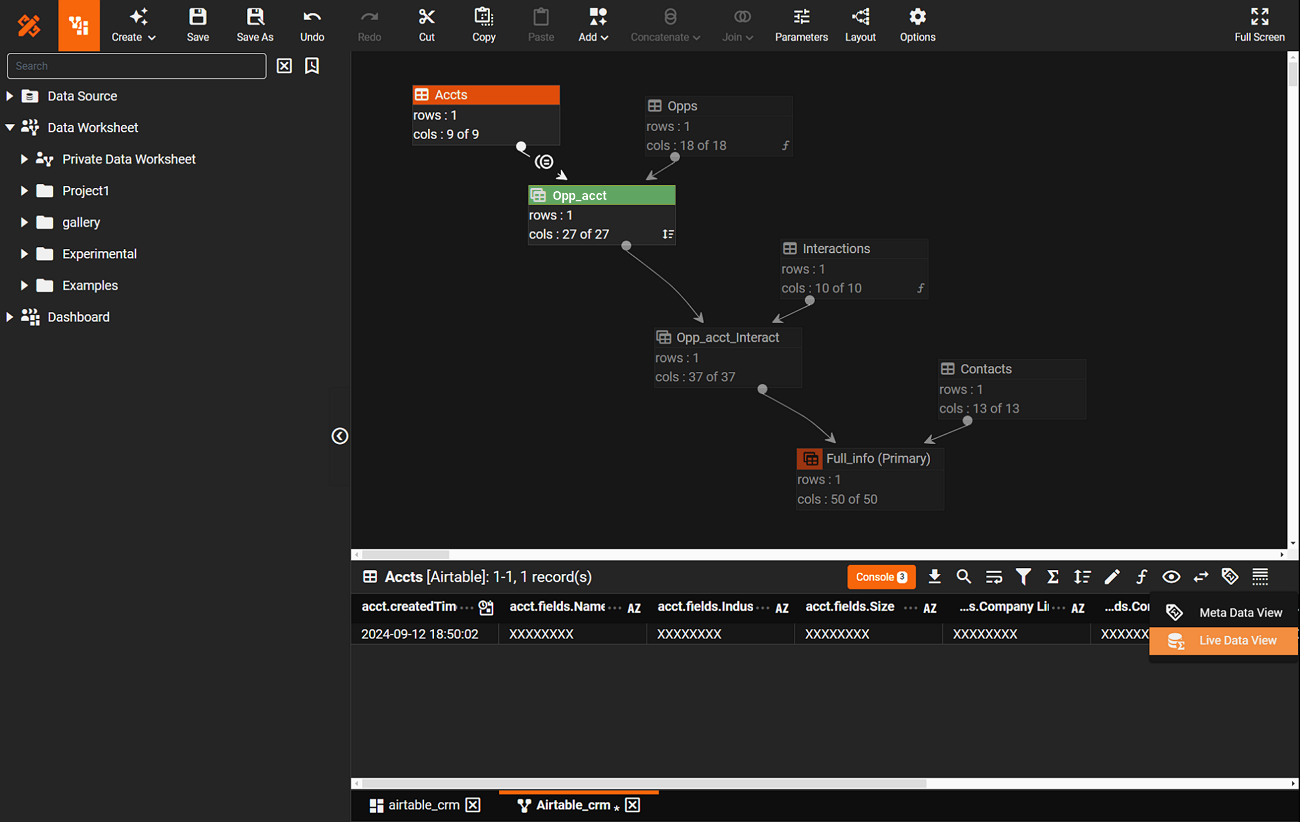
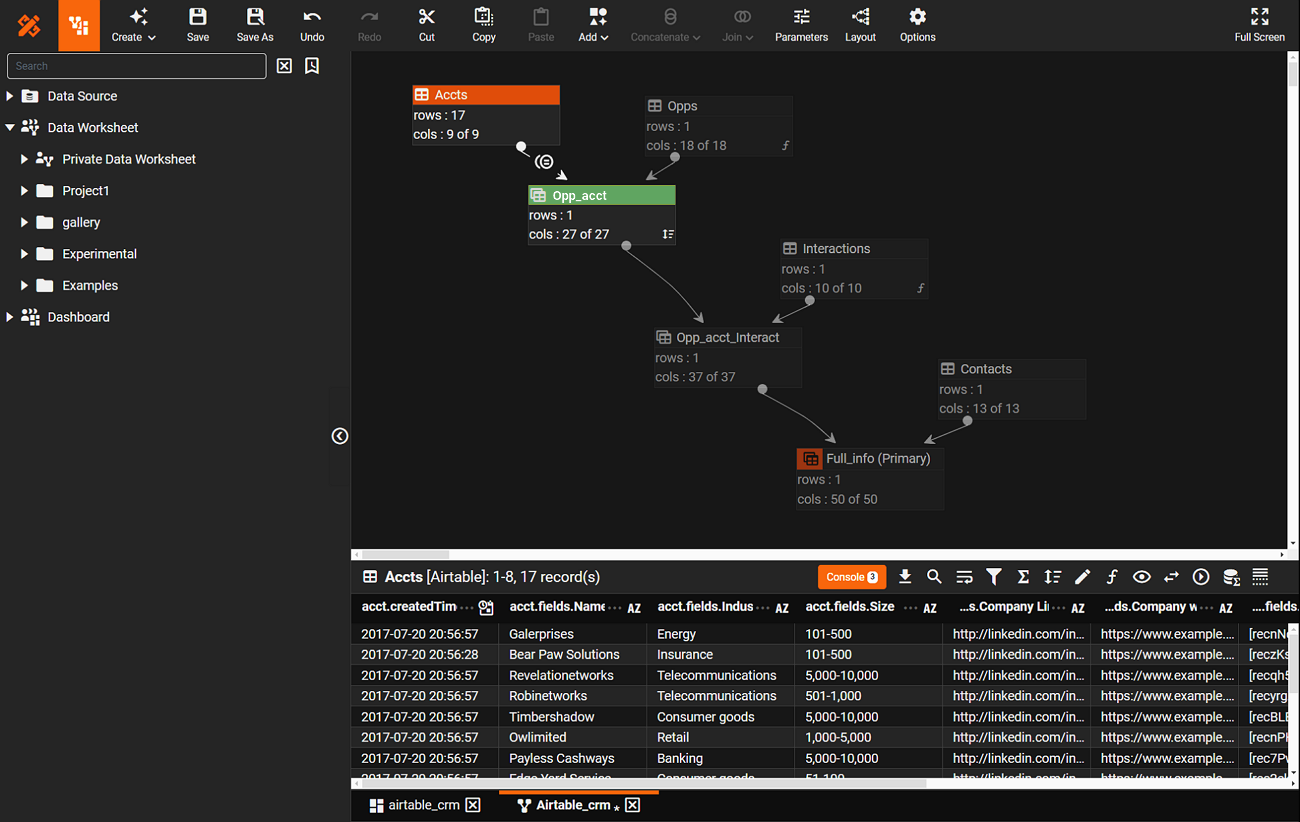


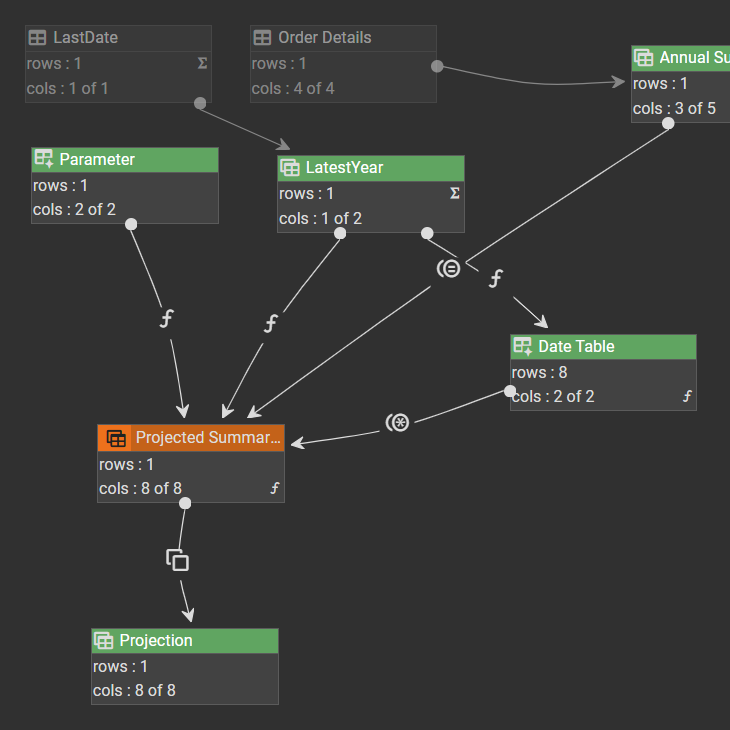
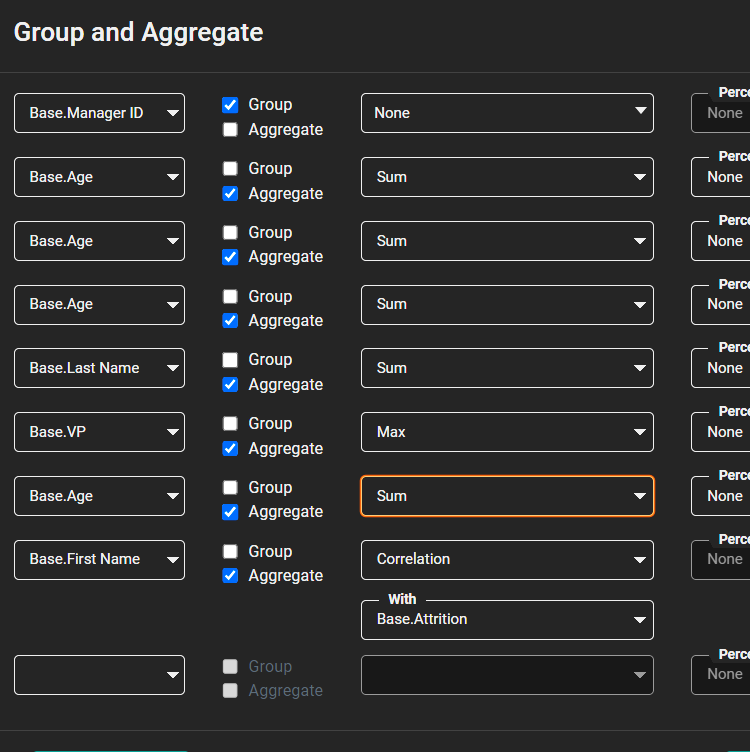
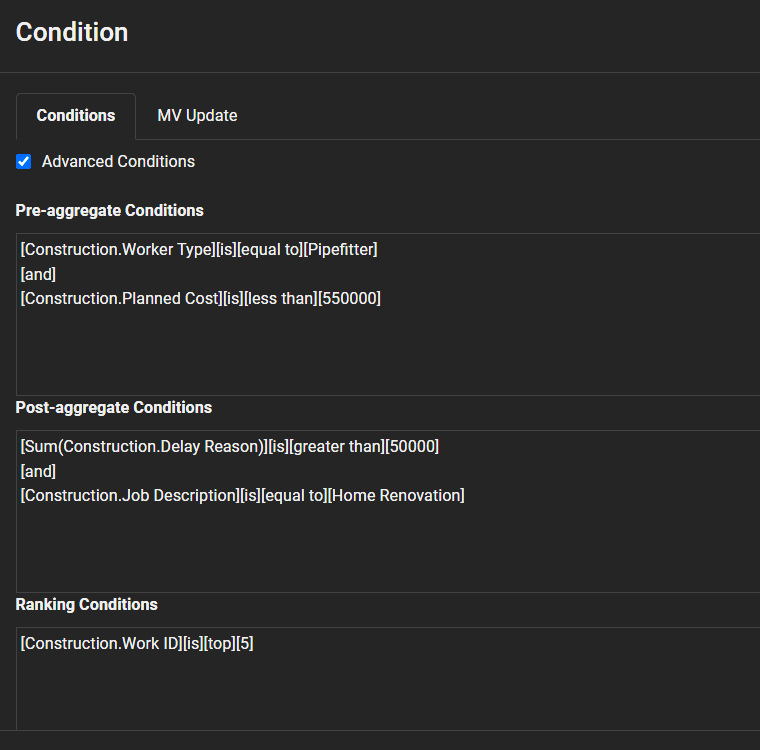
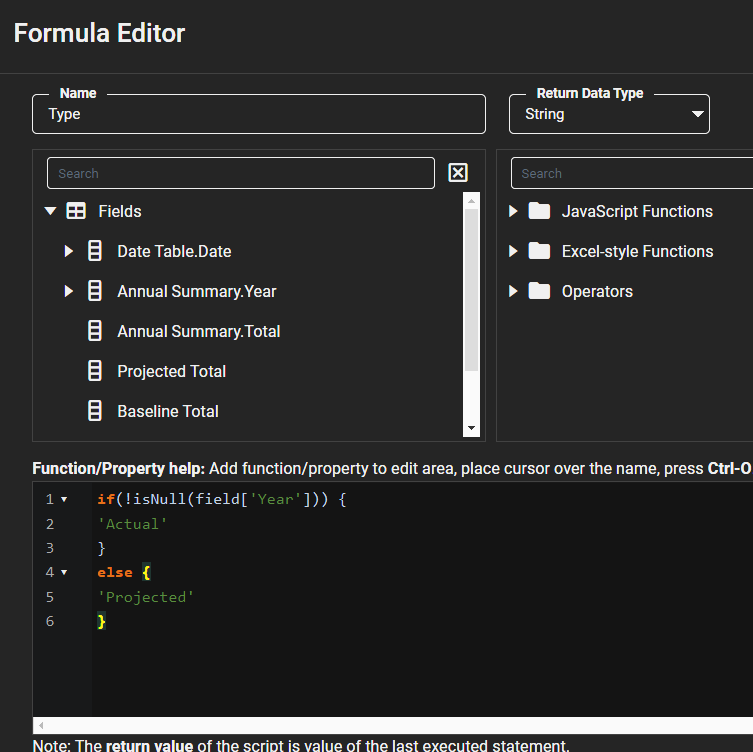
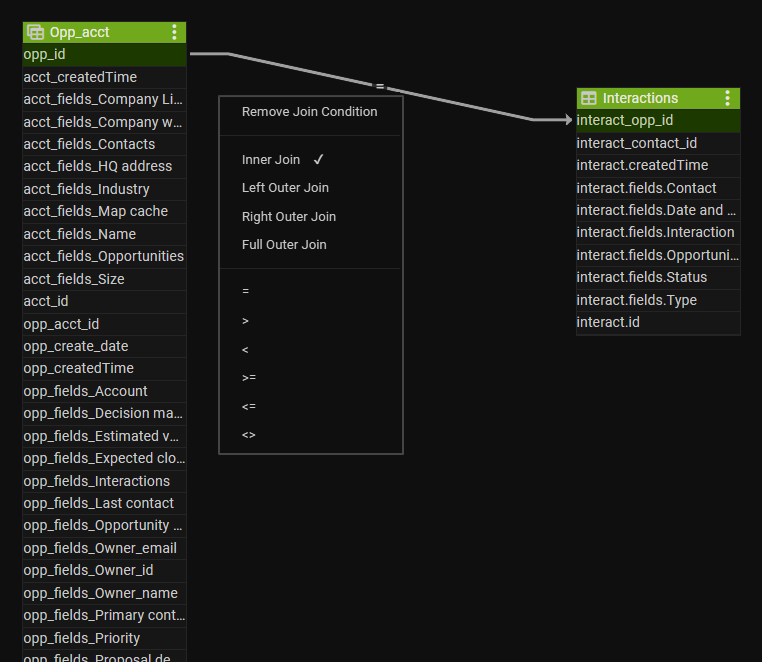
Prepare data
Rapidly transform and integrate disparate data visually using data pipelines. Apply formulas and scripts for enhanced data manipulation.
Learn More
1/5
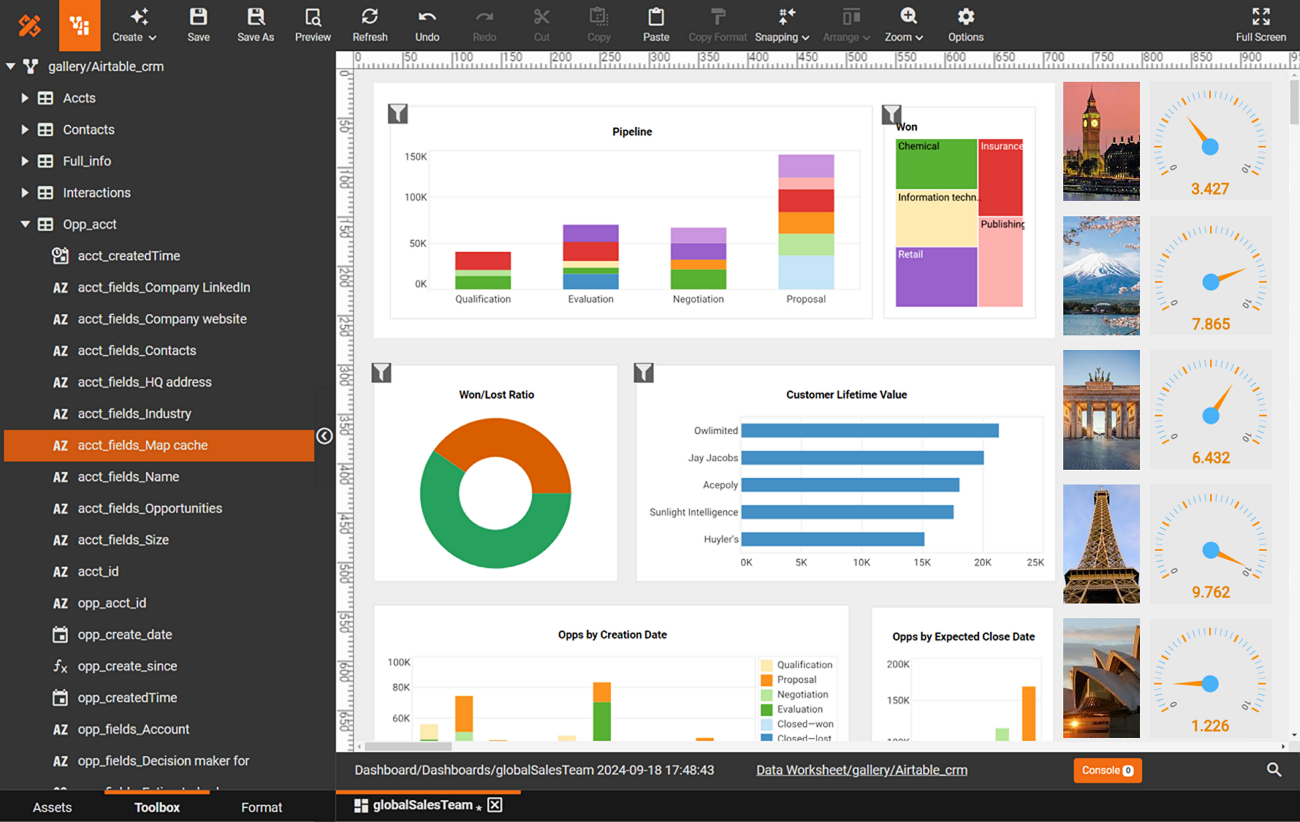
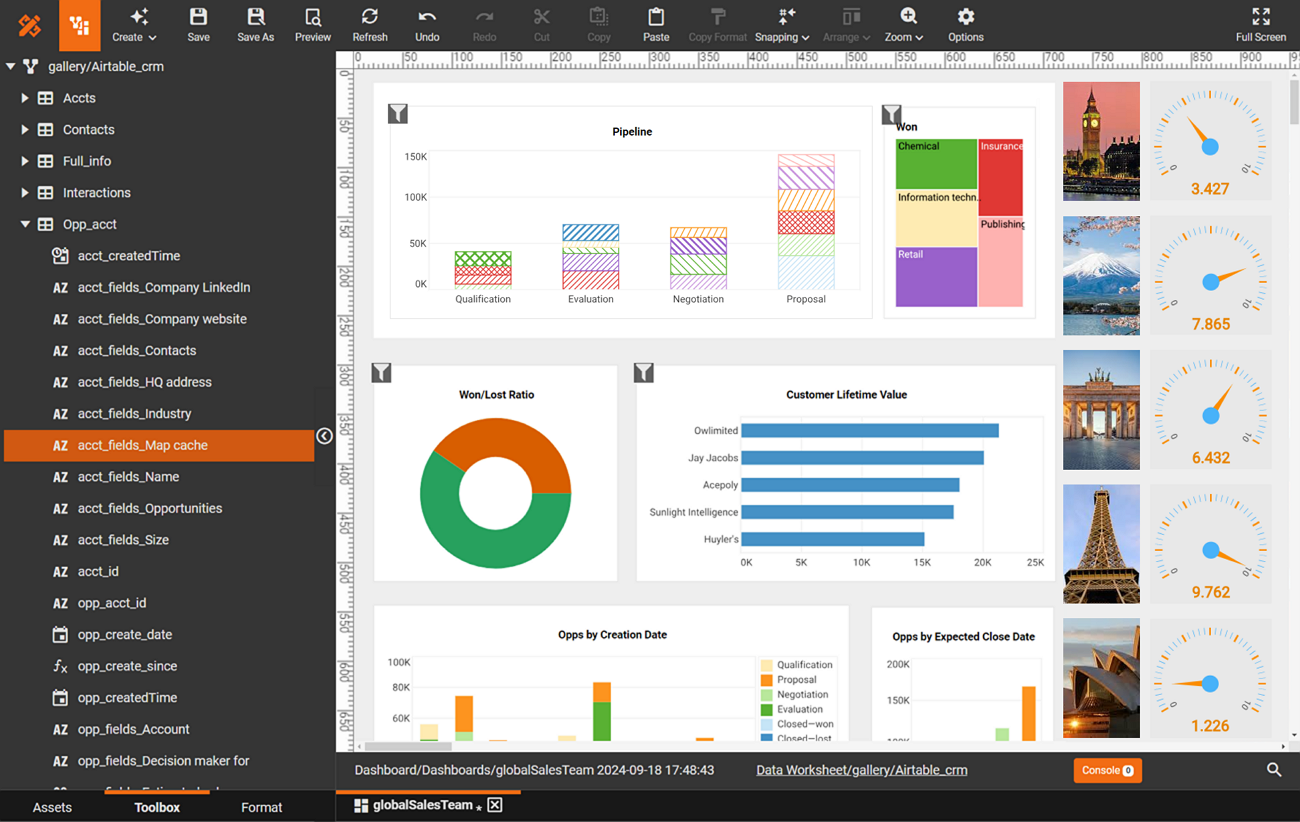
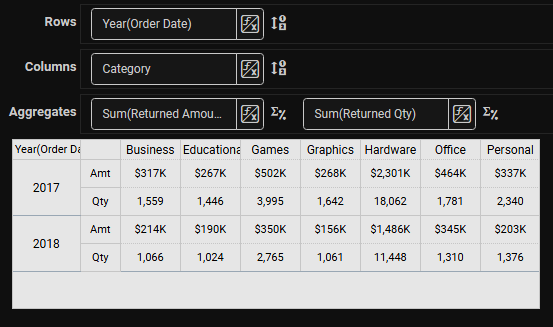
Visualize it
Visual analytics and reporting are delivered through interactive dashboards, featuring rich visual components with interactive elements. Built-in self-service capabilities empower users to explore data for deeper insights. In addition, dashboards can also be delivered as paginated reports.
Learn More

Turbocharge it
Transform data behind visualizations into a high-performance cache. Enable scheduled or on-demand incremental cache updates, all under administrator control.


Elastic Cloud DevOps
Manage, orchestrate, and scale BI as microservices within your cloud platform. Embed it in your
cloud applications with single sign-on and Web Components for a seamless user
experience.
Learn More
Learn More